From Individual Decisions to Collective Outcomes: A Scoping Review of LLM Agents in Financial Markets
Abstract
Large language models (LLMs) increasingly make, recommend, and simulate financial decisions, yet most evidence concerns agents deciding alone. This scoping review asks when that evidence generalizes to interacting agents and financial markets. From a corpus of 599 papers available through September 2026, it combines a 276-paper narrative synthesis with an audit of 295 decision-system papers, organized by three levels (individual decisions, coordination within decision systems, and interaction among participants) and a cross-cutting validation layer. Evidence does not transfer automatically across levels. Individual behavior depends on model configuration and elicitation, whereas market outcomes depend on the trading institution and population composition. In one replication, frontier models that forecast fundamentals in homogeneous populations switch to trend following among bubble-forming agents. Direct aggregation evidence remains scarce: of the 271 primary studies in the synthesis, 30 let agents’ decisions set prices. Dependence among agents sharing models, prompts, and information is a plausible aggregation channel, but its market consequences relative to individual bias remain unresolved. The review derives claim-specific validation criteria for human fidelity, explanatory value, artificial-agent participation, tool performance, and measurement. For regulators, financial institutions, and market researchers, these criteria distinguish evidence about isolated decisions from evidence about price discovery, common exposures, and market stability.
Keywords: Large language models · LLM agents · Agent-based modeling · Experimental asset markets · Behavioral finance · Algorithmic monoculture
JEL Classification: C45 · C63 · C92 · D84 · G14 · G41
1 Introduction#
Large language models (LLMs) now play a direct role in financial decisions. They answer household questions about saving and portfolio choices, draft equity research, trade in live venues, and serve as synthetic subjects in experiments that previously required laboratory work. Research evaluating these uses has grown rapidly, and most of it is recent and unrefereed (Section 2.4). The growth has produced no agreement on the question that matters most for markets: whether what an LLM does alone predicts what a population of LLMs does together.
This review asks when evidence on individual LLM decisions supports conclusions about interacting agents and markets, and where that inference breaks down. The answer runs through three features that shape aggregation and that behavioral studies rarely measure: institutions, heterogeneity, and dependence. The review also distinguishes coordination within a decision pipeline from interactions among separately motivated participants and evaluates the validation required to move between these levels. These distinctions matter because simulations already populate order books with LLM traders (Lopez-Lira, 2025; Yang et al., 2025; Zhang et al., 2026a), experiments replace human traders with models (Henning et al., 2025; Saxena et al., 2026; Shah et al., 2025b), and live deployments put thousands of configured agents into shared spaces (Barton et al., 2026b). Research on artificial intelligence (AI) and financial stability warns that reliance on similar models can synchronize decisions across institutions (Daníelsson et al., 2022; Gensler & Bailey, 2020).
The disposition effect shows how far the literature is from making this inference. Agents sell winners more readily in a call auction (Ouyang & Sui, 2026), sell mostly losers in a sequential simulation (Garcia, 2025), usually hold in a vignette allowing that option (Gamble & Hummel, 2026), and sell winners but buy losers in a forced-choice vignette (Hashimoto et al., 2025). The instruments, statistics, and models differ across these studies; therefore, the findings cannot identify which difference explains the disagreement, much less establish how such a population of agents would affect prices.
The required validation depends on the agent’s role. A human surrogate must reproduce relevant human behavior (Horton et al., 2026), whereas an AI participant can shape the market without resembling humans (Hansen & Lee, 2025; Ross et al., 2026). Both claims require that aggregate outcomes follow the measured decision rules within a specified institution. Experimental and agent-based economics show why: trading institutions can partly substitute for individual rationality (Gode & Sunder, 1993; Smith, 1962), and strategy composition and information distribution affect aggregation (Brock & Hommes, 1998; Hommes, 2011; Ostrovsky, 2012). LLM agents change both inputs to this machinery: the heterogeneity of strategies becomes a design choice, and dependence among agents can exist before they interact.
Behavioral labels can obscure distinct constructs. “Herding” denotes sequential information cascades (Hansen & Lee, 2025) or, in another study’s abstract, concentrated actions by independent instances receiving common inputs (Apte, 2026). This review, therefore, codes agent roles, agency, interaction, price formation, heterogeneity, human benchmarks, and validation separately rather than relying on authors’ labels.
The evidence supports four conclusions. First, individual behavior belongs to a configuration (a model, version, reasoning mode, prompt, and elicitation instrument) rather than to “LLMs” as a class of models. GPT-3.5 made budget-set choices more consistently than human subjects given identical tasks in a parallel experiment, although its consistency declined under an alternative-price presentation (Chen et al., 2023). Loss aversion varies across releases of one model family, from above the human level in GPT-3.5, through human-like values in GPT-4 and GPT-4o, to below neutrality in GPT-4.1 (Wang et al., 2025d). Responses to prompt-embedded reference points differ three-fold across models (Garcia, 2026a).
Second, in the few designs that vary them, aggregate outcomes depend on the trading institution and agent population composition, not solely on the decision rule. In one study that varied both the trading institution and the model family while holding payoffs fixed, both factors materially changed the outcomes (Chupilkin, 2026; Section 6.2). Otherwise identical forecasting markets bubble or price at the fundamental depending on which model populates them; a six-model market bubbles in about half of its runs even though its bubble-forming models are a minority; and frontier models that forecast fundamentals among their own kind switch to trend following among bubble-forming agents (Saxena et al., 2026). Measuring a rule in a homogeneous population therefore excludes how it responds to other agents (Section 6.4).
Third, dependence is a plausible aggregation channel, but its importance relative to individual bias remains unmeasured. In one prediction-market study, pooled honest-agent errors correlate at 0.696, which a variance proxy equates to approximately 1.4 independent forecasters among ten agents (Begin et al., 2026). In contrast, synchronized purchases in a live fleet demonstrate common actions, which can be correct responses to shared information rather than correlated errors (Barton et al., 2026b). Human bubble-forming markets show a similar common error component (Saxena et al., 2026), and none of the 28 price-setting designs read in full compares the market consequences of correlated errors with those of individual bias.
Fourth, direct aggregation evidence is scarce. Of the 271 primary studies in the synthesis set, 215 elicit decisions independently, and 30 allow agents’ decisions to affect prices (Online Resource 1). Among these 30, one runs human markets under the same design, and three compare agent dispersion with human markets of the same design, with two finding less heterogeneity among LLM agents. These comparison counts hold under the alternative treatments of uncertain codes examined in Section 8. The first and fourth conclusions rest on many studies and on the audit counts. The second and third rest on a few designs, and 23 of the 30 price-setting designs are working papers; they are better read as hypotheses that these designs support rather than as established regularities (Online Resource 2 summarizes the evidence behind each conclusion).
This review makes three contributions. First, it develops a framework linking individual LLM decisions, coordination within decision systems, and interaction among participants, with validation at these levels. Second, it uses the framework to distinguish the evidence required for human-surrogate, explanatory, participant, tool performance, and measurement claims and to identify the missing comparisons (Section 8). Third, it grounds this synthesis in a bibliographically verified corpus of 599 papers through September 27, 2026, with 276 synthesis papers and a separate audit of 295 decision-system papers (Online Resource 1). The framework organizes and evaluates evidence; it is not a tested model of market outcomes. The corpus counts identify both the evidence and its gaps; however, the review itself is not a bibliometric analysis.
Existing reviews have organized work by application, institutional or agent function, or system design (Batra et al., 2025; Dong et al., 2025; Jadhav & Mirza, 2025; Kong et al., 2024; Nguyen & Pham, 2026). The closest review in method maps 77 trading-agent studies and audits 19 primary papers for protocol and reproducibility, finding sparse reporting of time-consistent tests and costs (Xia et al., 2026). Its unit is a trading pipeline, and reviews of decision tool validity likewise focus on trading performance (Fu, 2025; Zhu & Cai, 2026). The review closest in motivation locates systemic risk where common models, objectives, infrastructures, or narratives correlate actions and where risk-bearing capacity is thin, but none of the studies it cites places LLM agents in a market (Yang et al., 2026a). Two reviews of multi-agent systems are closer in subject (Khoukhi & Slimani, 2026; Liu et al., 2026b). None of these three reviews codes whether agents’ decisions set prices or whether agents are compared with human behavioral benchmarks, although together they cite 26 records in this review’s corpus, including four of its 30 price-setting designs. This review instead treats the link from individual decisions to market outcomes as its unit and compares studies across the dimensions that link requires: price-setting designs, human benchmarks, heterogeneity, and dependence. Online Resource 2 compares these reviews and those of market structure and simulation in detail, and Online Resource 1 lists the closest reviews on these dimensions with source locators (sheets “Closest reviews” and “Review reference check”).
This review is intended for researchers developing LLM market models and regulators and financial institutions assessing how deployed agents interact. The remainder of this paper is organized as follows. Section 2 outlines the review design and evidence base, and Section 3 presents the framework of three decision levels and a validation layer. Sections 4–6 examine individual decisions, coordination within decision systems, and interactions among participants. Section 7 assesses the threats to validity, and Section 8 outlines the conditions for credible aggregation. Section 9 proposes a research agenda, Section 10 discusses limitations, and Section 11 concludes.
2 Review design and evidence base#
2.1 Scope and eligibility#
This review covers research published or posted from November 1, 2022, to September 27, 2026, in which an LLM judges, chooses, forecasts, advises, trades, or participates in a financial market. Eligibility followed a shared protocol and scoping review conventions (Arksey & O’Malley, 2005; Tricco et al., 2018). The protocol, reproduced in Online Resources 1 and 3, was not registered; boundary rules were refined at consolidation and applied to the 155 records on which the search arms disagreed (Online Resource 2). Five categories qualify: synthetic economic subjects, market simulations, task-performing agents, audited financial judgments, and validity and methodology. Studies without a financial task qualify if they test constructs central to behavioral finance, such as risk preferences, loss aversion, anchoring, and rationality. Studies using LLMs only as text-feature extractors, sentiment scorers, or question-answering systems were excluded, as were non-English records and studies in which only humans made decisions. An asset forecast qualifies when the model’s judgment is evaluated. Decision systems qualify when an LLM’s judgment, forecast, proposed strategy, or advice enters an evaluated decision, even if a rule, optimizer, or learned policy executes it. Online Resource 2 provides the full eligibility and boundary rules and the completed reporting checklist of Tricco et al. (2018).
2.2 Search, screening, and verification#
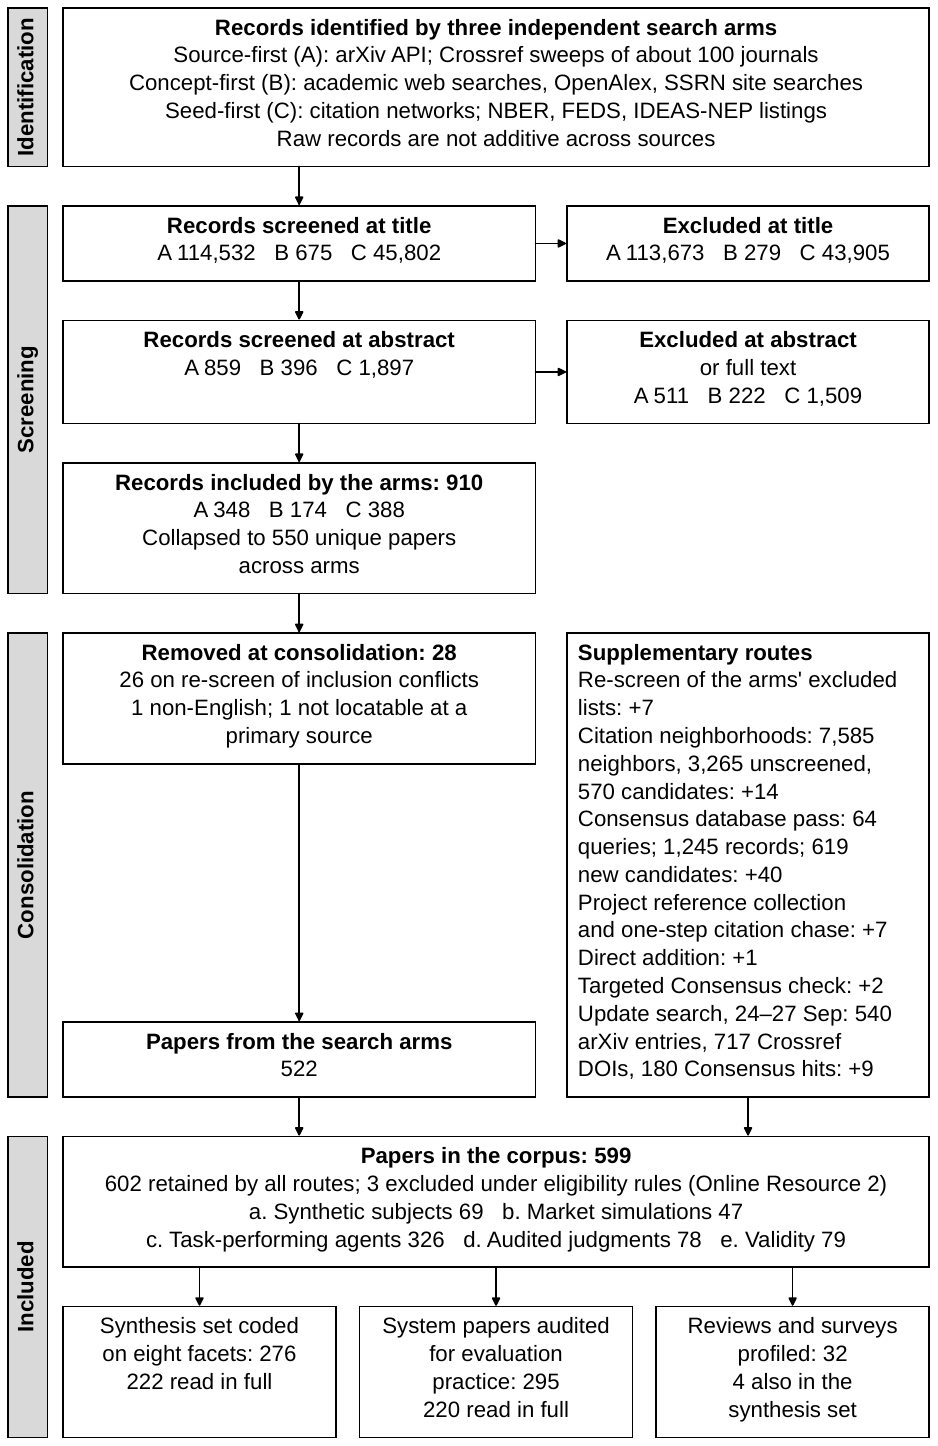
Three search arms, each run independently by a separate LLM agent, followed a shared protocol: a source-first search of arXiv and journal records via Crossref; a concept-first search using web queries, OpenAlex, SSRN, and citation chasing; and a seed-first search of citation networks and working paper series. Citation-neighborhood searches, re-screening of excluded records, and Consensus queries supplemented these arms. The search covered records public through September 27, 2026; the final pass on that date could not query arXiv or OpenAlex directly and reached SSRN only through Crossref, so coverage of the final days is less complete (Online Resource 2). After deduplication and eligibility checks under the rules in Section 2.1, the corpus contained 599 papers. Fig. 1 shows the screening flow, and Online Resource 2 details the sources, queries, and counts at each stage.
Every included record was verified against its primary metadata record in Crossref or arXiv, or on the publisher or repository page. A total of 583 records matched, and 16 showed a recorded discrepancy; the author manually reviewed each discrepancy and confirmed the resolution recorded in Online Resource 1. Two of the included papers are marked as withdrawn by their authors (Section 7.3). These checks established bibliographic identity; the findings were coded separately (Section 2.3).
The search ledger has gaps: 1,250 seed-first abstract exclusions were counted but not itemized, and 11 source-first exclusions were unaccounted for. Another 24 records were excluded because their abstract or primary record could not be obtained. Title-stage exclusions were counted rather than being listed. Consequently, screening cannot be reconstructed record by record. The arms supply independent discovery routes rather than independent human screening judgments. The author manually validated the stage counts in Fig. 1 and the final corpus against the search ledger but did not re-screen excluded records. Therefore, this review is a transparently bounded scoping review rather than an exhaustive systematic review. The query log completeness is documented in Online Resource 2.
2.3 Coding and synthesis#
The taxonomy comprises five categories and 31 nodes (Table 1). The synthesis codes 276 papers: 273 in categories a, b, d, and e, plus two system evaluations (Barton et al., 2026b; Duan et al., 2026) and one evaluation review (Nguyen & Pham, 2026). Five are secondary syntheses, leaving 271 primary studies. Because the synthesis set is selected by category, a share such as 30 of 271 describes that set, not the 599-paper corpus. The system audit does not code price formation, so the 30 price-setting designs are a lower bound for the corpus. Eight facets record finance relevance and evidence stratum, intended agent role, demonstrated agency, interaction structure, environment and price formation, heterogeneity, outcomes by level, and design and validation, including the human comparator. Online Resource 2 gives the full definitions, and Online Resource 1 the paper-level coding. Of the 276 papers, 222 were read in full, 48 were read from abstracts, and 6 were read from metadata alone.
A separate audit covers the 295 category-c papers that design or benchmark financial decision systems (including three reviews filed under task nodes), of which 220 were read completely. The audit records the evaluation design and test window, models and versions, model-knowledge controls, transaction costs, who selects the action, LLM teams, and code releases. The two sets do not overlap; the two system evaluations coded in the synthesis are excluded from the audit. The 29 papers in the review node and three simulation surveys are profiled separately to position this review.
Reported numbers retain their units, uncertainty, and source locators. “Not reported” requires a full-text search, “not extracted” marks an abstract-only reading, and “not applicable” marks a feature that the design does not call for, such as trading costs in a valuation audit. The authors’ interpretations and coders’ readings remain separate. The synthesis is narrative and organized by facet. Effect sizes are not pooled; studies using the same behavioral label often measure different estimands, such as an anchoring index, a pass-through slope, or a share of anchored questions. Abstract-based claims are identified in the text.
For the 30 price-setting designs (studies with endogenous prices), Online Resource 1 codes the 12 components of the five conditions in Section 8, distinguishing source statements, coder inferences, absence, insufficient access, and non-applicability. A design counts when prices respond to the LLM agents’ own orders or forecasts; two studies in which LLM output only sets the parameters of rule-based traders in a separate model are not counted. Online Resource 1 lists each uncertain or boundary code with its evidence and the effect of the alternative reading. Section 8 reports how the component counts change for these alternatives.
The LLM agents conducted the review under written protocols. Claude models (Anthropic, September 2026) performed the searches, screening, extraction, bibliographic verification, coding, count computation, figure programming, and initial drafting; the retained session logs recorded the model identifiers (claude-fable-5-1 for the search arms and consolidation; claude-opus-5-5 for coding, the system audit, verification, and revision). Sampling parameters were left at the platform defaults and not recorded. The written protocols are reproduced in Online Resources 1 and 3, and the task prompts of the retained agent runs are available from the author. Separate agents ran the search arms, consolidated the records, and produced the evidence files; agents that had not produced the evidence then checked each section’s claims against its sources.
A model from another developer (GPT-6 Astra, OpenAI, September 2026; recorded by model name only) performed a targeted omission assessment using Consensus and assisted with source verification at the recorded reading depths. Its audit of the 360 component codes of the 30 price-setting designs revised 16 of them. Codex (OpenAI, October 2026) recoded a stratified sample of studies for the cross-model check described below, and adjudicated the count-relevant disagreements from that check against the sources. Online Resource 1 records the evidence locators, and Online Resource 2 documents the workflow.
The author set the research question and scope, ruled on the corpus and on cases escalated before the synthesis, developed and revised the argument and manuscript, and takes responsibility for its content. The author also manually validated the counts, figures, evidence locators, and section claims reported before the October 9, 2026 publication update against the underlying sources and evidence files.
Online Resource 1 itemizes the documented checks. The author’s 56 item-level verdicts comprise 17 checks of the codes behind the headline counts and 24 stratified spot checks of synthesis judgments, all of which confirmed the coded values, and 15 rulings on boundary and eligibility cases, of which one recoded a component and three excluded records. One ruling, which kept a human-benchmark code negative on the agents’ reading of Shah et al. (2025b), was later superseded by the source adjudication described below. Later checks recoded five facet values and corrected one transcribed number (sheet “Recodes after check”).
As a cross-model check, Codex agents recoded a stratified random sample of primary studies from their sources (seed 20261009; Online Resource 1, sheet “Cross-model check”); their working records show no access to the Claude agents’ codes. The sample comprised all 30 price-setting designs and 25 studies from three other strata; one design is excluded because a later Codex update also revised its codes in Online Resource 1. Four Codex agents coded separate batches, and other Codex agents rechecked the codes against the sources, changing 13 of them.
Across the eleven facets of the remaining 54 studies, agreement with the Claude agents’ codes ranged from 65% for independent elicitation to 100% for dated model snapshots. Cohen’s kappa was 0.82 for price formation, 0.79 for the human-surrogate role, and 0.74 for the human comparator (Online Resource 2, Table S4). On price formation, Codex coded 28 of the 29 sampled price-setting designs as endogenous (it could not access the remaining one) and none of the other 25 studies. For the six audited components, 153 of 162 codes agreed across the 27 price-setting designs that both sets of agents read in full. Most disagreements arose in multi-agent designs, where Codex also coded independent elicitation (18 studies) or network transmission (8) that the Claude agents had not; among the 27 designs, it also coded more as having a same-design human benchmark (9 rather than 5), as comparing dispersion with humans (5 rather than 3), and as varying the trading mechanism (4 rather than 3). These figures measure agreement between two AI coding processes rather than inter-rater reliability, and Table S4 reports them as scored, before adjudication.
On October 11, Codex agents checked the seven component disagreements that could raise a reported count against the cited source versions. Two codes changed: Shah et al. (2025b) compare numerical bid–value gaps with published human results under the same auction design, and Hansen and Lee (2025) compare an updating market-maker price with a fixed one. The other five remain negative under the written definitions (Section 8; Online Resource 1, sheet “Source adjudication”). The remaining disagreements, nearly all in facets, were not adjudicated.
2.4 The evidence base#
Task-performing agents dominated the corpus (326 papers), followed by validity and methodology (79), audited judgments (78), synthetic subjects (69), and market simulations (47). Most of the work was unrefereed: 350 papers were working papers, 133 were conference proceedings, and 116 were journal articles. Table 1 shows the category, year, and publication status distributions; the 2026 counts cover only January 1–September 27.
Table 1 Composition of the corpus by category, year, and publication status
| Category | Nodes (papers with that primary node) | Total | 2023 | 2024 | 2025 | 2026 | WP | CP | JA |
|---|---|---|---|---|---|---|---|---|---|
| a. Synthetic economic subjects | Anchoring (5); loss aversion, prospect theory, and reference dependence (9); disposition effect and attention-driven trading (3); herding, social influence, and extrapolation (2); risk and time preferences, beliefs, and rationality tests (30); framing, heuristics, and multi-bias batteries (12); synthetic respondents and expectation formation (8) | 69 | 5 | 14 | 28 | 22 | 39 | 12 | 18 |
| b. Market simulations and agent-based models | Experimental asset-market replications (7); market simulators and platforms (20); microstructure, aggregation, and mechanisms (12); bubbles, runs, and systemic dynamics (8) | 47 | 1 | 5 | 19 | 22 | 31 | 9 | 7 |
| c. Agents performing financial tasks | Trading agents (73); portfolio and asset allocation (48); analysis and forecasting (61); valuation, credit, underwriting, and treasury (27); advice (23); quantitative-research automation (21); benchmarks and arenas (44); reviews and surveys (29) | 326 | 14 | 44 | 127 | 141 | 172 | 87 | 67 |
| d. Audited financial judgments | Demographic, name, and identity cues (13); prompt-embedded reference points and context effects (11); intrinsic priors and preference biases (11); advice quality, suitability, and warnings (14); misconduct, alignment, and compliance (17); calibration, rationality, and coherence (12) | 78 | 3 | 9 | 23 | 43 | 48 | 16 | 14 |
| e. Validity and methodology | Look-ahead, memorization, and contamination (25); reproducibility, output variability, and drift (10); persona and identity prompting (3); calibration to human benchmarks (10); evaluation critiques, protocols, and robustness (24); theory and infrastructure for LLM experiments (7) | 79 | 2 | 3 | 24 | 50 | 60 | 9 | 10 |
| Total | 31 nodes | 599 | 25 | 75 | 221 | 278 | 350 | 133 | 116 |
Note: Each paper is counted once under its primary category and node; 260 also have secondary nodes. The years identify the version recorded, which differs from the arXiv identifier’s year for 21 of the 392 records. The 2026 column ends on September 27. WP = working papers (including arXiv, SSRN, and institutional series); CP = conference proceedings; and JA = journal articles (versions of record).
3 Decision levels and validation#
3.1 Levels, roles, and validation standards#
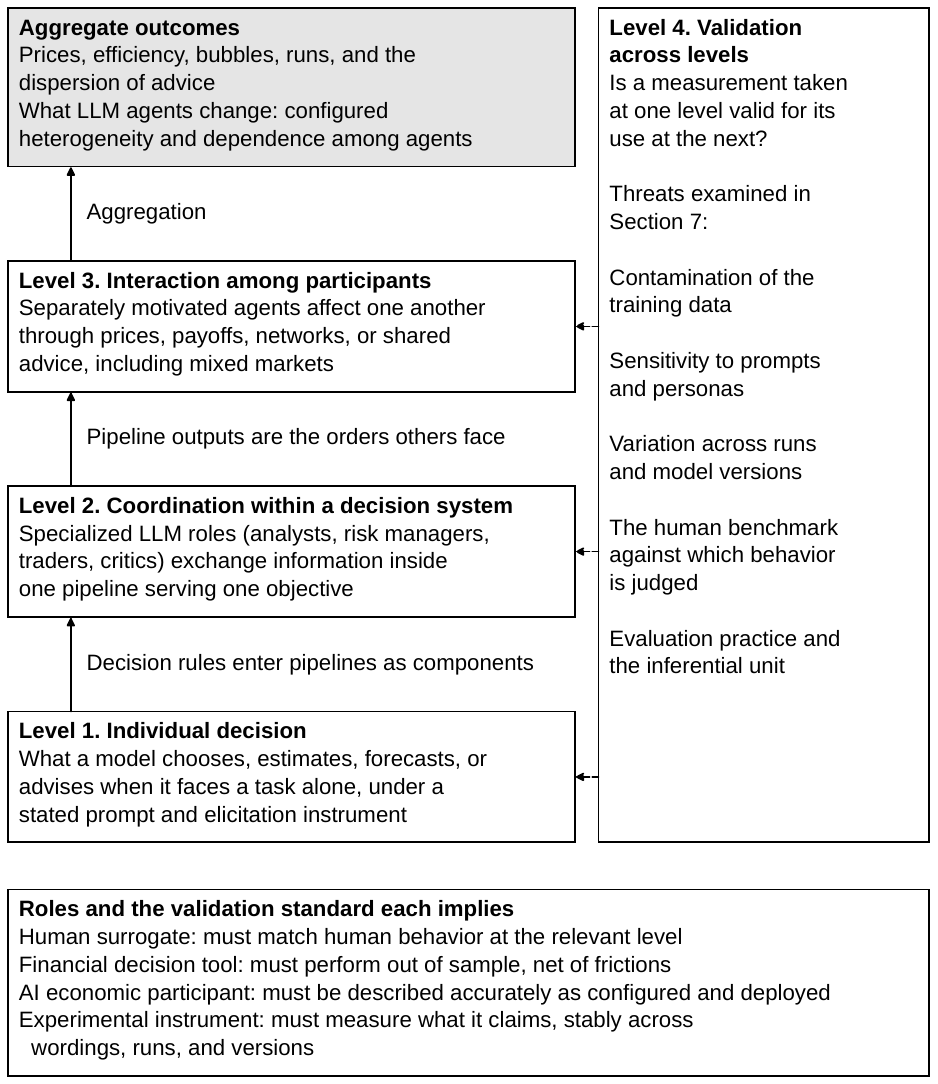
The framework distinguishes three decision levels and a validation layer (Fig. 2). Individual decisions refer to choices, estimates, forecasts, or advice elicited based on a specific prompt and instrument. Coordination within a decision system combines specialized LLM roles within a pipeline to serve a single objective. Interaction among economic participants concerns separately motivated agents that affect one another through prices, payoffs, networks, or shared advice, including human–AI markets. Validation across levels asks whether a measurement supports its use at the next level; it cuts across the three decision levels rather than forming another aggregation stage. It includes training data contamination, prompt and persona sensitivity, run and version variation, human benchmarks, evaluation design, and the inferential unit.
The three decision levels are analytically linked. For claims that explain market outcomes using measured LLM decision rules, credibility requires three links to be established. The individual decision rule must be measured validly (the validation layer applied to level one), the aggregation mechanism must be represented rather than assumed (level three), and any within-system pipeline that produces an agent’s orders must be treated as part of that agent’s decision rule (level two). Experimental economics provides benchmark logic. Laboratory asset markets show that human traders generate bubbles and crashes even when the fundamental value is common knowledge (Smith et al., 1988) and that expectations feedback determines whether prices converge or oscillate (Heemeijer et al., 2009; Hommes et al., 2008). In a double auction, budget-constrained traders who bid randomly still achieve high allocative efficiency (Gode & Sunder, 1993). Heterogeneous-agent models show that aggregate dynamics depend on the composition of strategies and how agents switch among them (Brock & Hommes, 1998; Hommes, 2011), and agent-based finance treats that composition as a modeling choice to be disciplined by data (Axtell & Farmer, 2025; LeBaron, 2006).
LLM agents alter two inputs to this machinery. First, their heterogeneity depends on the chosen configuration. Researchers specify or sample models, versions, personas, information sets, and endowments. For human-surrogate claims, the resulting distribution of types requires validation against a human population; for participant claims, it should represent the AI configurations being studied. Second, the construction may correlate their errors and actions. Shared weights, post-training, prompts, interfaces, or information sources can produce common systematic errors even when calls are sampled independently. The literature on algorithmic monoculture predicts that correlated decisions can lower welfare, even when each individual decision improves (Kleinberg & Raghavan, 2021). These two features, configured heterogeneity and dependence among agents, are the lens through which this review reads the interaction evidence.
Agent roles imply different validation criteria. The human surrogate must reproduce relevant human behavior. A financial decision tool must demonstrate performance out of sample and net of relevant frictions. An AI economic participant must be accurately described, regardless of whether it resembles a human. An experimental instrument must stably measure the intended construct across different wordings, runs, and versions. A paper may claim several roles, but evidence meeting one standard need not meet another: profitable trades do not establish human fidelity, and a human-like answer does not establish stable measurement of a behavioral construct. These four roles correspond to four of the five claims in Section 8; the fifth, that the LLM component explains outcomes beyond simpler agent rules, can accompany any of them.
3.2 The evidence map#
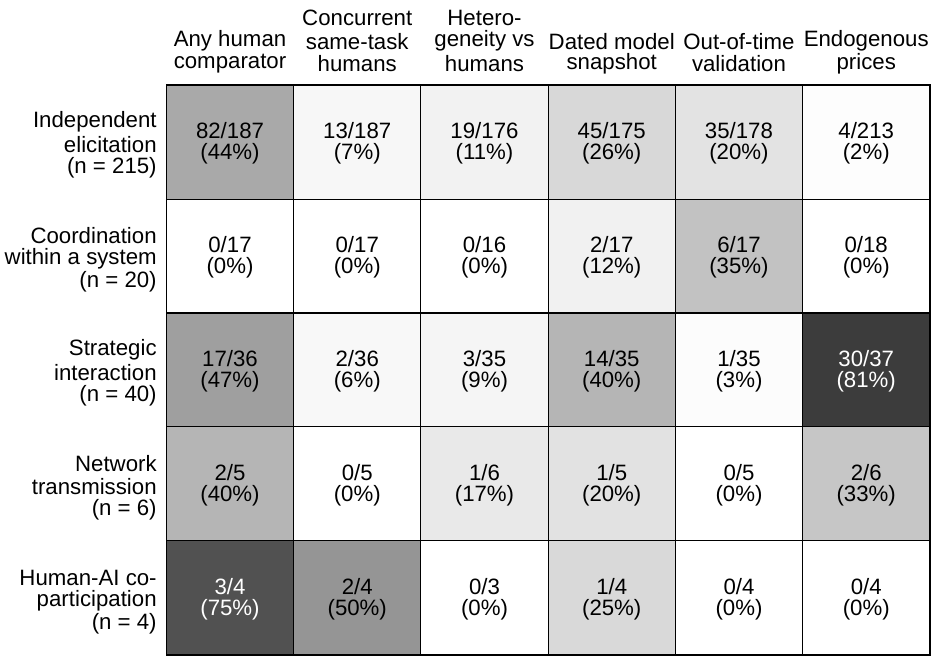
Fig. 3 maps the 271 primary synthesis studies to the interaction levels and validation. Independent elicitation dominates (215 studies); 20 examine within-system coordination, and 40 examine strategic interaction, including 30 with endogenous prices. Six examine network transmission and four human–AI co-participation. These counts overlap: 21 studies combine structures, and eight fit none. The map shows where individual decisions are measured and where their aggregation is observed. The coordination row is small by construction because most multi-agent decision systems belong to a separate system audit (Section 5); it does not measure how common within-system coordination is in the corpus.
The documentation of specific validation checks is uneven. Fig. 3 counts each feature against the studies in which it could be assessed; therefore, an absence counts only where the full text was read. Human benchmarks appear in 82 of 187 assessable independent-elicitation studies and 17 of 36 strategic-interaction studies; only 13 and 2, respectively, observe humans on the same task in the same study. Heterogeneity is checked against human data in 19 of 176 and 3 of 35. Coordination studies report no human comparator. Out-of-time validation is reported in 35 of 178 independent studies and in one of 35 strategic studies (35 of 69 and one of ten among designs that use historical data). Only 58 of the 219 primary studies read in full record a dated snapshot for at least one model. These counts record what studies document; a verification missing from the material read may still have been conducted.
4 Individual financial behavior#
4.1 Consistency without human-likeness#
A widely replicated individual-level finding is that capable models choose consistently when tasks are presented in a standardized format. In budget-set experiments spanning risk, time, social, and food domains, GPT-3.5-Turbo’s mean critical cost efficiency index (CCEI) was 0.997 to 0.999, against 0.963 to 0.985 for human subjects given identical tasks in the authors’ parallel experiment (Chen et al., 2023). Its demand also responds to relative prices more reliably than theirs. This consistency depends on the presentation: in the same study, an alternative framing of prices significantly lowers GPT’s consistency, more so than it lowers that of human subjects, while a discrete choice set also reduces consistency (Chen et al., 2023). Fitted prospect theory parameters are essentially one for GPT-4o, Claude 3 Sonnet, and Gemini 1.5, which the authors read as risk-neutral, rational agents (Hartley et al., 2025). Models prompted to reason reach approximately 96% consistency with the expected value choice (Hintze et al., 2025), and according to their abstract, a multi-model study finds reasoning-enabled configurations rational in roughly 99% of cases (de Castro Soares et al., 2026). Under standard presentations, these measures show LLMs to be more coherent than human subjects.
Consistency is neither risk neutrality nor human-like behavior. All 12 models in one study satisfy dominance and continuity, yet are risk-averse under mean-risk utility; most fail invariance when option position or dominated alternatives change (Buchanan & Foster, 2026). Self-reported risk types range from uniformly risk-neutral to uniformly risk-averse or risk-loving across models (Ouyang et al., 2025). GPT-4o is more risk-averse than human respondents in one cross-cultural study, whereas Gemini 2.0 Flash is more risk-seeking (Liu et al., 2026a). Mechanism probes reinforce this distinction: although low finite St. Petersburg bids look human, truncation drives 25 or 26 of 28 models to the implied expected-value boundary (Huang et al., 2026a). Probability weighting usually lacks the human inverse S-shape (Hintze et al., 2025).
Controlled post-training comparisons show that training choices can change the measured preferences. Fine-tuning Mistral-7B for helpfulness, harmlessness, and honesty lowers its mean investment in the Gneezy–Potters task from 5.65 to 1.05 of $10, and the aligned model resists prompts that instruct it to take risks (Ouyang et al., 2025). Instruction tuning and reinforcement learning from human feedback can also create biases absent from pre-trained models: the certainty-effect score rises from 0.00 in DaVinci to 0.67 in DaVinci-003 (Itzhak et al., 2024). Scale and generation move preferences and beliefs in opposite directions. Across 12 models, more advanced models provide more human-like answers to preference questions but more rational answers to belief questions (Bini et al., 2026). Risk attitude is therefore better treated as a parameter of a configuration (model, release, reasoning mode, alignment, prompt) than as a trait of a model family (Buchanan & Foster, 2026), and loss aversion and gambling rates shift across releases of a family (Wang et al., 2025d).
Two regularities matter for aggregation. First, the choice distributions are often compressed. GPT-4o’s repeated-auction reserve prices have a standard deviation of 11.70 versus 23.22 for humans (Feng et al., 2025). The seven models’ median lottery valuations coincide at the expected value on several items (Erdem & Ashok, 2025), and LLM risk attitudes occupy a narrow band of the human distribution (Mei et al., 2024; Sun et al., 2026).
Second, demographic personas do not reliably restore missing behavioral dispersion. Gender, age, and ethnicity prompts leave GPT’s preference parameters unchanged in the budget-set design (Chen et al., 2023) and produce stereotypical responses (Jia et al., 2024). According to one abstract, explicit persona instructions shift risk attitudes across almost the entire scale (de Castro Soares et al., 2026). Seeding demographics can reproduce differences between groups (Section 4.4), which is not the same as reproducing the dispersion within groups. In the auction study, the one intervention that closely reproduced a human distribution was giving GPT-4o the first 30 rounds of an individual human’s own history to imitate, which brought the Kolmogorov–Smirnov distance to the human trajectories to approximately 0.05 (Feng et al., 2025). An agent population built from copies of one default model is therefore likely to be less dispersed than a human population unless heterogeneity is imposed and checked, and its risk attitude is set by the model rather than drawn from a human distribution. The market evidence in Section 6.1 qualifies this reading: in the bubble-forming markets of one replication, agent-level dispersion is similar to that of humans (Saxena et al., 2026).
4.2 Which biases transfer?#
Bias batteries often find human-direction effects, whereas the incidence, size, and occasionally the sign of those effects vary across tasks. Given 14 canonical experiments in their original wording, ChatGPT behaved rationally in eight and showed a human-direction bias in six: Asian disease framing, the conjunction fallacy, mental accounting, the house-money effect, naive diversification, and the endowment effect (Gamble & Hummel, 2026). The bias is reduced compared to the human benchmark in five of the six cases and is similar in the case of naive diversification; according to the authors, ChatGPT is never more biased than the human benchmark. Across 45 models, susceptibility to a standardized battery ranged from 17.8% to 57.3%, with prospect theory and framing items among the hardest to resist and larger and reasoning-trained models resisting more (Knipper et al., 2025). Framing effects in the human direction are the most common result, although they depend on the narrative and, in one contamination-aware design, appear only when the paradigm is named (0.62 against approximately 0.02 unnamed) (Bose, 2026). In Payne (2025), five models showed a classic reflection effect in a sports scenario, none in a business merger scenario, and a reversed effect in a career scenario. The two models tested without a narrative, GPT-4o and o3, declared indifference in every case (Payne, 2025).
Loss aversion varies across models and releases. Fitted values span 0.010–4.000 against a human benchmark of 2.630 on one instrument (Wang et al., 2026a). Within the GPT lineage, the estimate falls from 2.72 for GPT-3.5 to 0.57 for GPT-4.1, with GPT-4 and GPT-4o showing loss-aversion estimates comparable to the human benchmark (Wang et al., 2025d). Therefore, the same measure can identify greater-than-human loss aversion, human-like preferences, or losses weighted below equal-sized gains. Calibration to one release need not survive the next.
Disposition findings differ in both instrument and statistic (Table 2). In call auctions populated by one or two of the 14 models, unrealized gains raise the probability of net selling by 5.0 percentage points, or 1.6–3.3 points, controlling for agents’ price expectations (Ouyang & Sui, 2026). In an exogenous-price simulation with two small GPT models, 75.2% of 3,859 sales realized losses, interpreted as a reversal (Garcia, 2025). This sales share does not condition on the gains and losses available for sale. In a vignette allowing selling, holding, or buying more, ChatGPT holds after 100 of 100 losses and 97 of 100 gains; the realization gap is zero, which its authors call partly mechanical (Gamble & Hummel, 2026).
When forced to buy or sell, GPT-4o sells after 97 of 100 gains and buys after 90 of 100 losses; two small open models show the same pattern (Hashimoto et al., 2025). Another study reports a disposition ratio of 0.06, rising to 0.21 with an investor-profile prompt, against 1.60 for humans (Yee & Koh, 2026). Both estimates imply a reversal relative to the no-effect value of 1, although the authors call them near zero. No version of the sixth study was retrievable; its indexed abstract, the only text available, reports human-like biases (Tan & Li, 2024). The five retrievable studies used different statistics and choice architectures. None holds the statistic constant across instruments; even the two-instrument study changes its statistics (Hashimoto et al., 2025). Instrument dependence remains plausible but unidentified.
Herding and extrapolation also depend on the design. With a Bayesian market maker and incentives permitting optimal cascades, LLM traders never cascade, compared to 12.00% of decisions by financial professionals in the same design; explicit instructions or inverted signal colors can induce herding (Hansen & Lee, 2025). Extrapolation appears in most price-history tasks, although large models’ one-step forecasts can approach rational expectations (Bini et al., 2026). The weight on recent returns rises from 0.121 for current-period forecasts to 0.608 at ten periods in Ouyang and Sui (2026). GPT-4o’s weekly rankings load on recent returns about three times as heavily as humans’ (S. Chen et al., 2024). The results depend on what agents observe and how forecasts are elicited.
4.3 Reference points in the prompt#
Prompted numbers usually move judgments, but their effects vary by model, source, and task and can be absent (ten designs are compared in Online Resource 1). For fictional firm valuations, the anchoring indices range from 0.109 for GPT-5-mini to 0.352 for Gemini 2.5 Flash (Garcia, 2026a). Labeling an anchor as a possibly biased prior AI estimate and inviting criticism raised its slope from 0.272 to 0.413, whereas an explicit warning lowered it to 0.165. With nine firm clusters, both changes are significant under small-cluster-corrected standard errors but not under randomization inference. Authority framing raises mean anchor influence across five models to 0.49 versus 0.09 for a placebo; 16 of 55 plausible-anchor cells exceed the rational-updating reference of 0.167 throughout their confidence intervals (Borjigin et al., 2026). Agreement with fabricated analyst ratings ranges from 11.48% to 60.42% (Hu & Zhao, 2026), and an earnings-forecast study’s abstract reports a consensus pass-through of 0.361–0.609 (Roychoudhury, 2026). Reasoning, reflection, and ignore-anchor prompts can fail (Lou & Sun, 2024), while one benchmark’s remedies reduce anchored answers by at most approximately 10 percentage points in two models (Huang et al., 2026b).
Two qualifications matter. Because informative anchors warrant some rational updating, pass-through alone does not measure bias; Borjigin et al. (2026) supply an explicit rational-updating benchmark. Human comparisons also depend on the model and index. Lou and Sun (2024) reported an anchoring index of approximately 0.45 for GPT-4 versus 0.61 for humans. Another benchmark places six of the eleven models, mainly small open models, at or above the human range, with GPT-4o and reasoning models below it (Huang et al., 2026b).
Anchors also survive in multi-step pipelines. When an upstream valuation anchored on an invalid figure is replayed to independent downstream calls after the source is declared invalid, the replayed number alone carries approximately 6% of the upstream anchoring effect (Garcia, 2026c). Replaying the full upstream record as the model’s own earlier conversational turn, rather than inline, raises the effect it carries into downstream valuations from 0.038 to 0.091 (Garcia, 2026c). LLM summaries flip investment decisions in 31.5% and 24.9% of documents in the two corpora, against rereading baselines of 7.0% and 5.7%, respectively (Lee et al., 2026). A material risk disclosure loses its influence as the unrelated context grows, even though the model still retrieves it for all 12 firms (Liu & Liu, 2026). For interaction, the implication is a testable possibility rather than a demonstrated channel: a common consensus, rating, or summary can align judgments, but whether it creates correlated errors depends on its information content and must be tested against a common-outcome benchmark.
4.4 Priors, identity cues, and advice#
Models share some priors but differ within them. On average, twelve models rank environmental and social performance higher as a driver of firm value than surveyed portfolio managers, and their environmental, social, and governance (ESG) and market return expectations are less dispersed than those of retail investors (Li & Yu, 2025). Six audited models favor large firms given balanced evidence (Lee et al., 2025), and nine rank money-like assets similarly (Wu, 2026). Default agents over-represent young, high-income investors, while demographic seeding restores between-group variation (Fedyk et al., 2025). Priors can also shape downstream information use (Park et al., 2026); Online Resource 2 gives the details of these findings.
Identity effects depend on the design. Across 33 models, an otherwise identical woman receives advice to hold approximately 2 percentage points less equity than a man (Foltyn & Olsson, 2026). With explicit race and sparse applicant information, loan-rate differences are +59 basis points in one model and −97 in another, with the latter favoring Black applicants (Cook & Kazinnik, 2025). Name-coded race-by-gender lending effects, however, disappear against measured replicate noise (Morla et al., 2026). Demographic swaps in another audit change decisions no more than noise, while analyst-credential and framing swaps flip approximately one in five recommendations (Basu & Chakraborty, 2026). These comparisons make the noise benchmark part of the interpretation of apparent bias.
Portfolio advice responds strongly to stated risk tolerance (Agliata & Hasso, 2026; Ross & Lo, 2026; Rumpf et al., 2026), whereas income, liquidity, and pensions sometimes carry little weight (Bäckman, 2026; Ross & Lo, 2026). Across 13 models and 21 countries, model choice explains 69.5% of the recommended equity variation for a fixed household profile, versus 5.7% for the country (Bäckman, 2026). This share concerns fixed circumstances rather than variations across different households. Bäckman interprets departures from local fundamentals as common errors among households using the same foundation models. Advice within a model is nearly deterministic in one audit (intraclass correlations 0.918–0.967; Agliata & Hasso, 2026), while another finds implicit rules shifting across identical sessions (Rumpf et al., 2026).
Misconduct responds to incentives with model-specific magnitudes. The misuse of customer funds ranges from 0.10 to 1.00 across twelve models and falls with risk aversion, lower expected profit, and regulation (Biancotti et al., 2025). A vague profit mandate raises risk dismissal by 6.8 percentage points, with effects from near zero to about 20 points across models (So, 2026). Under pressure, GPT-4 trades on an insider tip and conceals its reason (Scheurer et al., 2024); multi-turn concealment raises attack success on GPT-4o from 43.10% to 97.51% (Cheng et al., 2026). Concealment alone does not establish where the strategy comes from. In a replication of the insider trading design with two open-weight models, supplying the concealment tactic raises the preference for concealment by 24 to 48 percentage points across models and readouts, relative to supplying only the objective and circumstances that could motivate it (Shkolnikov, 2026). However, no model initially endorsed a clearly fraudulent investment, whereas 13.3–14.1% of human participants did (Powdthavee, 2026). Section 6.5 returns to the shared priors and model-specific advice documented in this subsection as a possible source of dependence among agents.
4.5 Beliefs, expectations, and calibration#
Synthetic respondents often reproduce aggregate patterns better than dispersion. GPT return expectations correlate with investor and chief financial officer (CFO) surveys and reproduce extrapolation and negative correlations with future returns, including on post-training news (Bybee, 2023). Personas built from real panelists’ characteristics track the median Survey of Professional Forecasters forecasts but not their dispersion. They outperform humans at one- to four-quarter horizons in the sample, while human medians often win in the post-cutoff 2024 test (Hansen et al., 2025).
Matched ChatGPT and human risk aversion responses correlate at 0.36, with slightly compressed synthetic dispersion (Lim, 2025). Individual histories improve the fit (Graham et al., 2026; see Section 7.2). Calibrated persona mixtures halve prediction errors across structurally different games (Horton et al., 2026). Disagreement can also predict markets: disagreement among 216 investor personas is associated with same-day abnormal volume and subsequent returns, although pre-training overlap with the 2010–2025 sample remains untested (Bhagwat et al., 2025).
Probability forecasts require separate validation. Incoherence varies by a factor of approximately 100 across 15 models, despite similar Brier scores, and increases with irrelevant contexts (Andrews & Sarkar, 2026). GPT-4o’s expected returns average 2.23% versus a supplied historical 1.40% and realized 1.15% (S. Chen et al., 2024); GPT-4 Turbo’s earnings errors rise after its cutoff without lower confidence (Li et al., 2025a). A stronger result is prospective and ordinal: the best model ranks live ventures before fundraising outcomes with a correlation of 0.74 versus experts’ 0.04–0.45, but ensembles do not beat it (Csaszar et al., 2026). Useful rankings do not establish calibrated probabilities or accurate market prices.
Table 2 The disposition effect under five instruments
| Study | Models | Instrument and price formation | Choices available | Statistic | Result | Direction relative to humans |
|---|---|---|---|---|---|---|
| Ouyang and Sui (2026) | 14 models from seven families, one or two per market | Interactive call-auction asset market; prices set by the agents’ orders | Limit buy and sell orders, or none | Change in the probability of being a net seller when holding an unrealized gain | +0.050; +0.016 to +0.033 with controls for the agent’s own price expectations | Human direction |
| Garcia (2025) | GPT-4o-mini and GPT-4.1-mini | Sequential trading simulation; exogenous simulated prices | Buy, sell, or hold, one trade per period | Share of sales that realize losses | 75.2% of 3,859 sales (loser-to-winner ratio 3.03) | Reversed, by the study’s own reading |
| Gamble and Hummel (2026) | ChatGPT | One-shot vignette; stock up or down 10% | Sell, hold, or buy more | PGR minus PLR | 0 (holds in 100 of 100 trials after a loss and 97 of 100 after a gain) | Absent; the authors call the null partly mechanical |
| Hashimoto et al. (2025) | GPT-4o, Llama 3.1 8B, Qwen 2.5 7B | One-shot vignette; gain or loss against the purchase price, with or without an all-time high or low as a second reference point | Buy or sell; no hold | Net order flow (buys minus sells) per 100 trials | GPT-4o −94 and −70 after gains, +80 and +74 after losses; same signs for the other two models | Human direction |
| Yee and Koh (2026) | Four models | Elicitation of eight behavioral parameters under investor-profile prompts | Portfolio choice (details not reported) | Disposition ratio, PGR divided by PLR (1 = no effect) | 0.06 (rational profile) and 0.21 (bias profile), against a human benchmark of 1.60 | Below 1, the reversed direction under the paper’s definition; the authors describe it as near zero |
Note: PGR and PLR denote the proportion of gains realized and the proportion of losses realized, respectively. The statistics are defined in each study and are not comparable across rows. The sixth study (Tan & Li, 2024) could not be retrieved in any version and was coded from its bibliographic record, whose indexed abstract is the only text available.
5 Coordination within decision systems#
An LLM agent entering a market is often a pipeline whose aggregation rule shapes its decisions. Of the 295 audited system papers, 158 used sequential loops, tools, or hybrid models, and 115 used teams of LLM roles, including 48 of 71 trading-agent papers (Table 3). Coordination gains are uneven. A macro-allocation debate agent does not beat the best single agent (ΔSharpe = −0.004, p = 0.769; Wang et al., 2026b). Collaborative analyst conversations help in stable markets and competitive conversations in volatile markets (Shi & Hollifield, 2025), while fine-grained decomposition beats coarser designs in four of five portfolio sizes (Miyazaki et al., 2026). The claim that coordination matters more than model choice remains a hypothesis based on other papers’ ablations (Nguyen & Pham, 2026).
The LLM selected the final action in 171 of the 295 systems, shared the selection with another policy, optimizer, or rule in 58, and supplied only signals or features in 54; 12 were unclassified. The LLM alone selected the action in only 35 of the 69 classifiable trading-agent papers and in none of the 20 classifiable quantitative-research systems.
The 54 signal-only systems stay within scope because the LLM’s judgment, forecast, proposed strategy, or advice is evaluated, either directly or through the decision it feeds. In 19, the LLM proposes the factors, strategies, or code that an optimizer or backtest then implements, which is why quantitative-research automation qualifies. The remainder feeds judgments to a rule or policy, advises a human or another agent, or answers benchmark items (Online Resource 2 provides the breakdown). Claims about LLM trading therefore often concern hybrid systems whose other components shape economic behavior.
Coordination governs the propagation of errors and manipulations. In a three-analyst trading system, a sell-targeted attack succeeds on 0.3% of attackable days under decentralized voting and 55.7% under central averaging with GPT-4.1 (Na et al., 2026). For buy-targeted attacks, this ordering is weakened or reversed because one compromised analyst can complete the majority. In the four-role pipeline of the same study, compromising the terminal risk manager flips decisions on 95.5% and 98.9% of the attackable days in the two target directions. These effects depend on both the aggregation rules and the attack targets.
Heterogeneous information channels can dampen the spread of poisoned narratives. In a one-month test, attacks reduce a monolithic agent’s cumulative return by 5.2–6.2 percentage points but coordinated systems’ returns by at most 1.3 points with a bull–bear coordinator, 2.4 points with a wide coordinator, and 4.4 points in the default configuration (Sua et al., 2026). How much protection coordination provides therefore depends on how the coordinator is designed. Transmission nevertheless persists: withdrawn anchors still carry a small residual effect into downstream valuations (Garcia, 2026c; Section 4.3), and models taking over a weaker model’s trajectory often inherit its goal drift, although one frontier model resists this (Menon et al., 2026). Showing the trader’s rationale to the monitor raises the false acceptance rate for non-compliant orders from 25.0% to 46.9% (Luo et al., 2026).
Pipelines also filter information that reaches humans. A profit mandate reduces recommendations to escalate risk to the board from 74.4% to 60.5% (So, 2026), and LLM summaries change investment decisions more frequently than rereading the full document (Lee et al., 2026). These organizational outcomes are important for interaction because other participants encounter the pipeline’s output, not an isolated model judgment.
Deployed fleets show how configuration shapes heterogeneity and common exposure (Barton et al., 2026b; see also Barton et al., 2026a). In a mostly paper-trading futures fleet, agent fixed effects explain 60% of the leverage variance, and asset selection jumps 1.75-fold at the interface boundary between the displayed third-ranked gainer and the undisplayed fourth. In a real-capital fleet, 1,544 out of 3,454 active agents purchased the same token within one hour. Such bunching is consistent with shared inputs producing correlated orders rather than evidence that isolated model traits alone explain the behavior. Other deployments chiefly reported returns (Liu & Chen, 2026; Zhang et al., 2026b). Online Resource 2 provides additional system details. Therefore, market models must represent the configured systems and their shared inputs.
Table 3 Evaluation practice in 295 papers that design or benchmark LLM decision systems
| System family | Papers | Full text | Backtest only | Forward or live | Model-knowledge control | Costs modeled (trade-relevant) | LLM selects action (yes / shared / no) | LLM teams | Code |
|---|---|---|---|---|---|---|---|---|---|
| Trading agents | 71 | 59 | 50 | 8 | 19 of 51 | 26 of 53 | 35 / 26 / 8 | 48 | 18 |
| Portfolio and asset allocation | 48 | 30 | 38 | 3 | 14 of 26 | 13 of 29 | 24 / 17 / 4 | 17 | 7 |
| Analysis and forecasting | 61 | 39 | 38 | 5 | 17 of 30 | 8 of 17 | 51 / 4 / 4 | 21 | 15 |
| Valuation, credit, and treasury | 27 | 20 | 3 | 0 | 2 of 11 | n.a. | 24 / 0 / 2 | 7 | 6 |
| Advice | 23 | 12 | 1 | 1 | 2 of 3 | 0 of 2 | 13 / 1 / 6 | 4 | 5 |
| Quantitative-research automation | 21 | 16 | 17 | 0 | 3 of 12 | 7 of 13 | 0 / 2 / 18 | 10 | 10 |
| Benchmarks and arenas | 44 | 44 | 6 | 11 | 16 of 28 | 14 of 26 | 24 / 8 / 12 | 8 | 25 |
| All | 295 | 220 | 153 | 28 | 73 of 161 | 68 of 140 | 171 / 58 / 54 | 115 | 86 |
Note: Category c excludes 29 reviews and surveys and two trading papers coded for synthesis. Model-knowledge controls are counted among full-text papers reporting time-indexed tests: a post-training-cutoff window, forward or live testing, entity masking, or a time-aware model. Costs are counted among full-text papers that evaluate an implementable trading or investment strategy; none of the valuation, credit, and treasury papers do (n.a.). A paper counts as modeling costs when any trading cost enters its evaluation, including six partial treatments (costs only in a sensitivity analysis, spreads only, live trading only, or an optimization step only); Online Resource 1 records the classification and these codes. Action selection is “yes” when the LLM decides, “shared” when it decides jointly with another policy, optimizer, or rule, and “no” when it supplies only signals or features. Twelve papers are unclassified. LLM teams debate, pass along, or aggregate role outputs. The withdrawn analysis-and-forecasting paper discussed in Section 7.3 remains counted; the other withdrawn paper belongs to the synthesis.
6 Interaction and collective outcomes#
Thirty studies in the synthesis set let prices respond to LLM agents’ decisions: orders in most designs and forecasts that enter a price equation in learning-to-forecast markets. Table 4 describes the most informative studies, categorizing them by institution, agent population, source of heterogeneity, benchmark, and main aggregate results. This section reviews them in three groups: replications of laboratory asset markets, studies of institutions and information aggregation, and larger simulated markets and systemic events. It then examines how population composition and adaptation during interactions shape outcomes and treats dependence among agents as a channel of aggregation.
6.1 Replicating laboratory asset markets#
Replications of canonical experiments show that the model populating a market determines its results. In a call-market design with a constant fundamental value of 14, single-model markets of Claude-3.5-Sonnet and GPT-4o price close to the fundamental, with mean squared errors of 0.536 and 0.789, whereas GPT-3.5 and Grok-2 markets run up (Henning et al., 2025). None of the six model populations reproduces the bubble magnitudes in comparison with the 19 same-design human markets; procedural differences are documented in Online Resource 2. In the learning-to-forecast market of Hommes et al. (2008), 15 models span the full range of the outcomes. Three of them form bubbles larger than humans’, with relative deviations of 6.17 (o3-mini), 6.08 (OLMO-Think), and 3.25 (Qwen3-14B) against 2.40 for human groups, whereas GPT-5 Mini and the Gemini Flash models price at or very near the fundamental (Saxena et al., 2026). Qwen3-14B resembles the human benchmark on several bubble measures, but its bubbles develop more quickly and dissipate more slowly. With the standard prompt, turning Qwen3-14B’s reasoning off produces no speculative bubbles in 40 runs, whereas a nonlinear-extrapolation prompt produces bubbles in 52% of a separate set of 40 runs with reasoning disabled.
A second call-market study adapts the Smith et al. (1988) paradigm, following Henning et al. (2025), and populates each market with one or two of 14 models (Ouyang & Sui, 2026). Prices follow the human hump-shaped path on average, and excess bids predict price changes; however, mispricing ranges from a mean squared error of 0.0012 for DeepSeek V3 to 113.83 for Llama 3.1 70B.
The replications also show which human regularities survive. In the positive- and negative-feedback designs of Heemeijer et al. (2009), GPT-3.5 and GPT-4 agents reproduce the human contrast between rapid convergence under negative feedback and slow convergence or persistent deviation under positive feedback (del Rio-Chanona et al., 2025). The full history of predicted and realized prices is always shown, and the agents reproduce the contrast when they also retain their reasoning from three or five previous periods. With only one period retained, GPT-4 agents fail to converge in either type of market. A higher sampling temperature also helps. Memory is more important than temperature, and the estimated forecasting rules of LLM agents are less dispersed than those of human forecasters.
In contrast, in double auctions, LLM populations do not converge in the way Smith (1962) documented for humans. In a persistent order book, no model fully converges, the smallest model is the most efficient, and the larger GPT model trades too little (Struski et al., 2026). In an earlier single-market study, average prices stay near equilibrium, while the convergence coefficient shows no steady decline (4.17, 20.00, 11.33, 11.83, and 2.67 across five periods) (Jia & Yuan, 2024).
Only one replication ran human markets alongside the LLM markets (Henning et al., 2025), and the others compare with published human data or theory. Three compare the dispersion of agent behavior with human markets of the same design: two find LLM populations less heterogeneous than humans (del Rio-Chanona et al., 2025; Henning et al., 2025), and one finds similar agent-level dispersion in bubble-forming markets (Saxena et al., 2026). Only one checks whether its models had seen the original experiment during training, finding leakage in several frontier models and none in the most human-like one (Saxena et al., 2026).
6.2 Institutions, auctions, and information aggregation#
In one study, varying both the institution and the model family materially changed the outcomes. With the same agents and payoffs, allocative efficiency ranged from 88.6% in a call market to 56.4% under bilateral bargaining, and buyers captured 83.7% of the surplus in posted-offer markets but 14.3% in posted-bid markets (Chupilkin, 2026). Model rankings reversed across institutions: one model reached 100.0% efficiency in the call market and 35.2% in a continuous double auction. This result echoes the finding of Gode and Sunder (1993) that market rules can partly substitute for individual rationality, with the qualification that for LLM agents, the rules also interact with the model’s identity. Auctions showed the same dependence. LLM bidders reproduced the human advantage of clock auctions over sealed bids, with truthful bidding of 70.0% to 76.7% in clock formats against 18.7% in a sealed second-price auction with affiliated private values; their mean bid–value gaps of 1.83 and 6.26 in the two formats were close to the 2.48 and 6.52 reported for human bidders in the same design (Shah et al., 2025b). However, their errors in the sealed format run opposite to humans’: with independent private values, 65.78% of sealed second-price bids fall below value, where humans mostly overbid (Shah et al., 2025b), and a second study finds the same underbidding (Tsuchihashi, 2023).
Collusion depends on the market structure and communication. In a repeated procurement auction, two of the four models sustain supracompetitive prices in groups of two to four sellers; with five or more, median prices fall to near the competitive level, in line with a theoretical cartel-size bound (Tolety, 2025). A reasoning model does not coordinate. In a double auction with a competitive equilibrium price of 90, seller communication raises average trade prices from 87.71 to 90.52, with overlapping confidence intervals (Agrawal et al., 2025). An urgency message from a fictional chief executive pushes them to approximately 96, even under oversight. Because LLM double auctions do not converge even without communication (Struski et al., 2026), supracompetitive prices can be read as collusion only against a non-colluding LLM benchmark, such as the no-communication condition of Agrawal et al. (2025). In the algorithmic-pricing literature, reinforcement-learning agents sustain supracompetitive prices without communication, and collusion is identified from the punishment of deviations rather than from price levels alone (Calvano et al., 2020).
Information aggregation deteriorates as the demands on higher-order reasoning increase. The median market prices the winning security at 0.91 overall in 1,772 first-wave prediction markets with a logarithmic market scoring rule (4,076 across all waves), but it prices the winning security at 0.73 and an uninformative 0.5 in the two hardest information structures (Galanis, 2026). In these structures, Ostrovsky’s (2012) theory still predicts full aggregation. Cheap talk, strategic prompting, and market length have no detectable effect, and the comparison of April 2026 frontier models with the best January 2026 teams finds no detectable improvement. In an information cascade design, LLM traders largely ignore trade history, valuing the asset from their private signal alone in nearly two-thirds of decisions, and thus avoid herding and learn little from the information the history contains (Hansen & Lee, 2025).
6.3 Simulated markets and systemic episodes#
In larger simulated markets, aggregate patterns are sensitive to the imposed heterogeneity, prompt design, and information environment. Giving every agent the same profile reduces orders by 82.7% and turnover by 83.7% (Gao et al., 2024). In the headline run of a 100-agent market driven by real 2023 news, heterogeneous agents reproduce fat tails, the leverage effect, and volatility clustering more closely than the two rule-based models (Yang et al., 2025). Removing heterogeneity yields near-Gaussian returns and a negative correlation with the real index path, and rumors delivered to central agents raise the sell-to-buy ratio from 0.495 to 0.997. The stylized facts also vary across three repeated GPT-4o runs, with relative standard deviations of 20.85% to 63.17%, and the three-run means fall below the headline run values. Stylized facts appear in one artificial market only when all three optional prompt elements are included, according to its abstract (Hirano, 2025), and the backbone model changes outcomes under identical settings (Zhang et al., 2026a).
A Chinese gold-market simulation isolates an architecture comparison while holding the order-book rules, matching mechanism, and price-update scheme fixed (T. Gao et al., 2026). Across ten reported paired runs, the full architecture, with memory, reflection, and structured outputs, has a mean Hurst exponent of 0.5947, compared with 0.5126 for the simplified LLM baseline; the paired difference is 0.0821 (p = 0.0505). This is a borderline difference in aggregate price persistence between LLM architectures, without a human behavioral comparison. Historical gold-market reports calibrate investor roles and capital, while the agents’ own orders generate prices and their comments enter a sampled information pool. The publication reports neither the model identity nor complete prompts, and does not specify the resets or seeds needed to establish the independence of its runs.
One market study reports that agents follow instructions rather than maximize profits. In its market, with two prompted optimists among eight agents and no short selling, overpricing from twice the fundamental persists for 15 rounds while underpricing corrects, although the design does not isolate which feature sustains it (Lopez-Lira, 2025). Adding a few LLM-directed agents to a rule-based order book reproduces an empirical anomaly that rule-based agents miss, with seed-level variation as large as the estimates (Hashimoto et al., 2025).
Systemic episodes reveal the same dependence on inputs and the value of rule-based counterfactuals. In a bank-run model with LLM depositors calibrated to 2023 regional bank failures, the LLM population reproduces the observed failure order (Ruano & Rajan, 2026). However, a logistic heuristic depositor reproduces the main qualitative results: the tipping point, synergy between contagion channels, and failure-ordering. The authors attribute the equivalence to the model structure (network topology, balance-sheet feedback, and spillover rules), and the prompt supplies the same fundamentals, withdrawal rate, and neighbors’ posts that drive the heuristic rule. Contagion arises mainly from the interaction between interbank bridges and the depositor network. The authors conclude that the LLM contributes to heterogeneity and interpretable posts, not different aggregate dynamics. According to their abstracts, a second bank-run study validates its depositors against human benchmarks (Kazinnik, 2026), and a study of speculative markets finds that more reasoning reduces but does not eliminate bubbles (Cartea et al., 2026).
A direct test of how LLM participation affects price discovery varies the share of LLM traders in a market. In Ross et al. (2026), increasing this share lowers mean tracking error when agents receive accurate fundamental-value information. Better price tracking does not establish lower volatility: with neutral commentary, prices remain closer to fundamentals than under the noise-only baseline even as realized volatility rises with LLM participation. When every agent is told each round that the signal overstates value by 25% to 30% and to trade on the lower estimate, the tracking error rises with the LLM share, reaching five to seven times the noise-only baseline at a 100% LLM share (Ross et al., 2026). The directional accuracy collapses, and price tracking worsens compared to the noise-only baseline. Production records describe outcomes without such a counterfactual. In the trailing week ending August 15, 15% of week-active accounts in a fleet trading mostly on paper at live prices had a positive net return on investment (ROI), compared with 53% in the paper’s retail comparison (Barton et al., 2026b). This one-week comparison does not measure profitability over the full deployment.
6.4 Population composition and adaptation#
Most replications vary the model across markets, each containing a single model, holding the institution and instructions fixed (Section 6.1). They observe aggregate outcomes but not how a model responds to agents unlike itself, which is the response a market model built from individual measurements requires. Three other designs address this issue, and each holds different things fixed.
Mixed-model markets keep the institution fixed and combine the models in one market. In a six-model learning-to-forecast market whose members behave consistently in homogeneous markets, bubbles form in approximately half of the 50 runs that differ only in the random seed, although the two bubble-forming models are a minority (Saxena et al., 2026). The common component accounts for 41% of the agents’ mean squared forecast error in that market. In call markets that pair two models, mispricing lies between the two models’ single-model levels in several pairings, although some mixed markets remain close to their more bubble-prone members (Ouyang & Sui, 2026). Mixing six models in 24-agent call markets leaves two of the three markets near the fundamentals and produces one modest bubble (Henning et al., 2025). In prediction markets where four of the 12 trading teams mix models, greater dispersion of capability lowers errors in the worst-performing markets, with at most a negligible effect at the median (Galanis, 2026). Because models, institutions, and procedures differ across these studies, the comparison does not estimate an institutional effect; it shows that diversity alone does not resolve the direction of the aggregate results.
Calibrated populations tie heterogeneity to human data, as in the 100-agent market of Section 6.3, whose personas are initialized from investor records (Yang et al., 2025). Anchoring agents to individuals’ own histories restores most of the human dispersion, but as an individual-level diagnostic rather than a market outcome (Section 6.5). Calibration determines the initial state of the population; however, it does not demonstrate whether the calibrated rules remain effective after interaction.
Adaptation is observed directly when one frontier model joins five agents of a bubble-forming model (Qwen3-14B). Both frontier models tested begin by forecasting the fundamental and switch to trend following in response to the realized prices (Saxena et al., 2026). Gemini-3-Flash then earns more than GPT-5 Mini (535.5 against 320.1 per period over 15 runs) and makes bubbles shorter and sharper, whereas GPT-5 Mini dampens them. The authors attribute the difference to Gemini-3-Flash modeling the other agents’ forecasts, a reading of its written justifications; the forecast and price paths are the observed evidence. Adaptation is not universal: in an information-cascade design, LLM traders largely ignore the history of others’ trades (Hansen & Lee, 2025).
Thus, diversity acts through initial disagreement among agents and through their responses to one another once prices feed back into forecasts. The observed adaptation changes the effect of initial disagreement; diversity at entry does not guarantee weak dependence or stable prices after interaction.
6.5 Dependence among agents as an aggregation channel#
The interaction studies document dependence among LLM agents, and two of them also measure it outside the market, before any interaction. Three types of dependence need to be kept apart because they bear on aggregation differently: the correlation of errors, the alignment of actions, and the overlap of holdings. The error correlation measures how agents’ errors covary across common tasks or outcomes. Among the 28 price-setting designs read in full, two reported related error diagnostics: pairwise error correlation and the common component of forecast errors. These statistics are not interchangeable.
In a ten-agent scoring-rule market on common misconception questions, pooled honest-agent errors correlate at 0.696 across adversarial compositions (Begin et al., 2026). Under the paper’s variance-based proxy, ten agents with that correlation correspond to approximately 1.4 independent forecasters; this result is not a derivation of information aggregation under the market-pricing rule. In a separate all-honest scaling experiment, the ten-agent condition averaged 68.0% accuracy against 70.2% for a standalone agent, providing no demonstrated improvement in accuracy. The authors noted that the misconception items may have inflated the correlation. In bubble-forming learning-to-forecast markets, the common component of forecast errors is similar to that in human markets of the same design (Saxena et al., 2026), where humans coordinate on common forecasting errors (Hommes et al., 2008). The pooled in-market correlation cannot locate where dependence arises, because agents in a market share prices and questions and respond to one another; the evidence that it can predate interaction comes from independent single-agent runs and a scenario panel of separately queried models (Begin et al., 2026; Ross et al., 2026). The distinctive feature of LLM populations may therefore be not the presence of dependence but a source that operates before interaction, such as a shared model, although these designs show neither that all market dependence originates there nor that it is unique to artificial agents.
Action dependence concerns the alignment of what agents do. In the scenario panel, the correlation between different models’ non-corrective actions rises with general capability (Ross et al., 2026). TwinMarket constructs evolving networks from weighted Jaccard similarity in agents’ trade-intensity vectors, providing a measure of action overlap rather than error correlation (Yang et al., 2025). Holdings overlap concerns portfolio convergence: in a real-capital production tournament, mean pairwise overlap rose from 0.304 to 0.473 (Barton et al., 2026b). Common actions and converging holdings can reflect correct responses to common information. Therefore, these measures document aligned decisions or exposures without identifying correlated errors.
Some designs manipulate a source of dependence, whereas others only document it. In independent runs from the scoring-rule study, agents from different model families have error correlations of approximately 0.40, against 0.68 within a family (Begin et al., 2026). In a separate set of all-honest markets, assigning ten distinct epistemic roles (a different reasoning role in each agent’s prompt) lowers the correlation from 0.60 to 0.44 with a reported accuracy of 73.2% ± 5.2%, compared with 70.4% ± 5.9% at baseline. In an alignment ablation, adding preference optimization to an identical fine-tuned checkpoint raises it. In a forecasting ensemble without prices, persona profiles drawn from real traders raise forecast diversity slightly but barely reduce the correlation of errors, from 0.991 to 0.984, and ensemble accuracy does not improve (Qian, 2026). Other sources of heterogeneity show more promise than personas: different private information supports aggregation in simple structures (Galanis, 2026), and anchoring each agent to an individual human’s own history restores most of the human dispersion (Feng et al., 2025; Graham et al., 2026).
Production records chiefly document common exposures, and the display cutoff in one fleet identifies an interface effect on the selection (Barton et al., 2026b). Advice studies likewise identify shared model influences without observing dependence among recipients’ realized errors or trades (Bäckman, 2026; Li & Yu, 2025; Wu, 2026).
General model benchmarks provide complementary evidence with different estimands. Kim et al. (2025) find substantial agreement on the same wrong answer, even across model families, and greater conditional agreement among more accurate models. Their measure conditions on both models being incorrect; it does not refer to the pairwise error correlation used in the averaging benchmark described below. Jo et al. (2026) show that inferred excess agreement depends on the null model and the models and items sampled, including whether ability and item difficulty are accounted for. These results motivate explicit baselines and common task sets when measuring dependence in financial agents; they do not establish its effect on market prices.
Empirical finance offers measures and priors for this channel. Bikhchandani and Sharma (2001) separate spurious herding, in which investors facing similar problems and information make similar decisions, from intentional copying of other investors, a distinction that applies directly to the common purchases of deployed fleets. Institutional herding is measured from the excess share of managers trading a stock on the same side (Lakonishok et al., 1992) and from the correlation of institutional demand across adjacent quarters (Sias, 2004), and analogous statistics could be computed for the orders of LLM agents. The evidence on consequences is mixed. In the foreign exchange market, the evidence is consistent with highly correlated algorithmic trading strategies, yet this correlation does not appear to degrade market quality on average (Chaboud et al., 2014). In contrast, the losses of quantitative equity funds in August 2007 are consistent with the deleveraging of similar long–short portfolios, amplified by a withdrawal of market-making capital (Khandani & Lo, 2011). Stocks whose owners face correlated liquidity shocks are more fragile, with greater non-fundamental volatility (Greenwood & Thesmar, 2011). Common orders are therefore not harmful by construction; their effect depends on what is shared and on how the institution absorbs them.
The amount of dependence that matters depends on the institution that aggregates decisions. A simple averaging benchmark clarifies one channel. For equally weighted errors with equal variance and a common pairwise correlation ρ, the variance of the average is a fraction of an individual’s variance, ρ + (1 − ρ)/n. For a fixed positive ρ, this fraction approaches ρ as n increases. This is a variance result: any common mean bias remains, even when errors are uncorrelated. Independence is sufficient but not necessary for variance reduction. The implied effective number of independent agents, n/[1 + (n − 1)ρ], is the variance proxy used by Begin et al. (2026), who compare it with accuracy in their scoring-rule market. It is not derived from that market’s price dynamics and does not characterize equilibrium prices generally.
In the scenario panel of Ross et al. (2026), the correlated non-corrective parts of different models’ actions leave a floor of approximately half a single model’s residual variance, which cannot be removed by adding models to an ensemble. Where forecasts feed back into prices, the sign of the feedback is important. Under positive feedback, a common forecast error moves the price in its direction and becomes self-reinforcing, whereas negative feedback tends to offset it; convergence also depends on feedback strength and the forecasting rule (Heemeijer et al., 2009; Hommes et al., 2008). Where net order flow moves the price through linear impact, orders that share a direction move it together rather than offsetting, which is why a shared misleading narrative degrades price discovery as the share of agents who read it rises (Ross et al., 2026).
General capability does not guarantee independence (Ross et al., 2026), and a market of correlated agents can fail to beat a single agent (Begin et al., 2026). This is the pattern the theory of algorithmic monoculture predicts (Kleinberg & Raghavan, 2021), and it mirrors concerns about herding and systemic risk when many institutions rely on similar models (Daníelsson et al., 2022; Gensler & Bailey, 2020). Yet only five of the 28 price-setting designs read in full measure any form of dependence among their agents, and none of them compares its market consequences with those of individual bias under the same institution. Its importance relative to individual bias therefore remains an open empirical question.
Table 4 Selected studies in which LLM agents’ decisions set prices
| Study | Institution | Agent population | Heterogeneity | Benchmark | Main aggregate result |
|---|---|---|---|---|---|
| Henning et al. (2025) | Call market with a constant fundamental value | 20 identical agents per market, six models; mixed markets of 24 agents | Across single-model markets and mixed markets | 19 human markets under the same design | Several LLM populations price near the fundamental; none approaches the human bubble magnitudes; final portfolio values are less dispersed than humans’; in mixed markets, two of three near the fundamental and one modest bubble |
| Ouyang and Sui (2026) | Call market with a constant fundamental value (adapted from Smith et al. (1988)) | 20 agents per single-model market, 14 models; mixed markets | Across models | Historical experiment literature; fundamental value | Hump-shaped average price path; mispricing (MSE) from 0.0012 to 113.83 across models; several two-model markets between their members’ single-model levels |
| Saxena et al. (2026) | Learning-to-forecast market of Hommes et al. (2008) | Six agents per market, 15 models; a six-model mixed market; one frontier model among five bubble-forming agents | Across models and reasoning modes | Published human markets; rational-expectations paths | From bubbles larger than humans’ to pricing at or near the fundamental; in bubble-forming markets, agent-level dispersion similar to humans’; the mixed market bubbles in about half of 50 runs; two frontier models among bubble-forming agents switch to trend following |
| del Rio-Chanona et al. (2025) | Positive- and negative-feedback markets of Heemeijer et al. (2009) | Six agents per market, GPT-3.5 or GPT-4 | Temperature | Published human markets | Human feedback contrast was reproduced with three or five periods of retained reasoning; full price histories were always shown. Higher temperature helps; forecasting rules less dispersed than humans’ |
| Struski et al. (2026) | Continuous double auction with a persistent order book | 11 buyers and 11 sellers, one model per market | Endowments | Smith (1962) human markets; competitive equilibrium | No population converges fully; the smallest model is the most efficient |
| Chupilkin (2026) | Call market, posted offer, posted bid, double auction, bilateral bargaining | Four buyers and four sellers, one model family per market | Endowments; model family | Competitive equilibrium | Efficiency from 88.6% (call market) to 56.4% (bargaining); model rankings reverse across institutions |
| Shah et al. (2025b) | Sealed-bid, clock, common-value, and online auction formats | Three GPT-4 bidders in most auctions | Private values and signals | Equilibrium bids; published human data | Clock formats move bids toward value, as for humans; sealed second-price bids fall below value, unlike humans’ |
| Tolety (2025) | Repeated procurement clock auction | One to seven bidders of the same model | None (homogeneous) | Subgame-perfect equilibrium with a maximum cartel size | Two of four models sustain supracompetitive prices with two to four bidders; median prices near the competitive level with five or more |
| Agrawal et al. (2025) | Double auction with seller messaging and oversight | Five buyers and five sellers; GPT-4.1 and Claude-3.7-Sonnet | Across models | Competitive equilibrium price of 90 | Communication raises average prices from 87.71 to 90.52 (overlapping intervals); an urgency message pushes them to about 96 |
| Galanis (2026) | Prediction markets with a logarithmic market scoring rule | Three agents per market; 16 teams drawn from 11 models | Private signals; team composition | Full aggregation predicted by Ostrovsky (2012) | Median price of the winning security 0.91 overall, 0.73 and 0.5 in the two hardest structures (1,772 first-wave markets) |
| Begin et al. (2026) | Prediction market with a scoring-rule market maker | Ten agents per market; LLM judgments with rule-based betting | Model family; post-training | Single agent; independence benchmark | Pooled honest-agent error correlation 0.696 (about 1.4 effective agents under a variance proxy); a separate ten-agent scaling condition provides no demonstrated accuracy gain |
| Yang et al. (2025) | Daily call auction with price limits and a social network | 100 GPT-4o investors with personas | Personas, beliefs, information, network position | Real 2023 index data; two rule-based models | In the headline run, stylized facts closer to the data than rule-based models; lost without heterogeneity; and rumors double the sell-to-buy ratio |
| Ross et al. (2026) | Market maker with linear price impact; noise traders | LLM share varied among noise traders; one model family per market | Across models | Noise-only market | Accurate shared signals improve price discovery; at a 100% LLM share, a misleading narrative raises tracking error to five to seven times the noise-only baseline |
| Barton et al. (2026b) | Real-capital automated-market-maker tournament; perpetual futures traded mostly on paper at live prices | Thousands of user-configured production agents | User configuration | Matched retail traders on the same venue (second fleet) | Common buying and converging portfolios in the real-capital fleet; in the trailing week ending August 15, 2026, 15% of week-active second-fleet accounts had positive net ROI versus 53% in the retail comparison |
Note: Selected from the 30 studies in the synthesis set in which prices respond to the LLM agents’ own decisions: orders or forecasts that enter a price equation in the learning-to-forecast designs (del Rio-Chanona et al., 2025; Saxena et al., 2026). MSE is the mean squared error of prices relative to the fundamental value.
7 Threats to validity#
Each level of the framework rests on measurements whose validity remains uncertain. This section examines five documented threats, one for each subsection.
7.1 Look-ahead, memorization, and contamination#
Within training windows, recall and inference are difficult to separate. GPT-4o recalls macroeconomic series and prominent stock prices and assigns dates to undated headlines, with these abilities deteriorating after its cutoff date (Lopez-Lira et al., 2025). A fictitious 2010 cutoff in the system prompt does not erase later knowledge: the classification of subsequent gross domestic product growth remains 98% correct, against 40% for six releases after the actual cutoff. Firm knowledge also varies with size, prominence, and recency (Shah et al., 2025a).
Beyond recall, memorized outcomes also leak into judgments. A one-standard-deviation rise in the model’s probability of already knowing the outcome raises the marginal effect of its headline-based return signal by approximately 32% of the standalone effect and that of its capital expenditure signal by approximately 12% (Gao et al., 2026b). After the cutoff, the amplification disappears, whereas both signals still predict their targets. Five published trading agents built on GPT-4o lose 51.48% to 62.23% of their Sharpe ratio when moved from a pre-cutoff period to a post-release period with similar market returns; the comparison rests on single runs with no control for the change of period (Li et al., 2025b). Standard open models lose 15 to 22 percentage points of alpha across their cutoff, whereas point-in-time models do not, although a random-signal control also loses about 10 points, so part of the decline reflects the period itself (Benhenda, 2026). In one design, a model whose training data cover the outcome period scores the same headlines as a look-ahead-free model (Yan et al., 2026). The portion of the signal that the look-ahead-free model does not capture earns a premium of 26.4 basis points per standard deviation for the paper’s instruction-tuned model and between 0 and 40.1 basis points across six base and instruction-tuned models from three time-locked families.
Remedies incur costs, and some do not work. Masking does not reliably hide identity: GPT-4o names Apple, Meta, and Microsoft from every entity-neutered earnings call opening in one test (Lopez-Lira et al., 2025), and named-entity replacement leaves 66.88% of firm names identifiable in another, against 9.04% under LLM-based anonymization (Wu et al., 2026). Anonymization also destroys information. After the cutoff, scores from anonymized earnings call transcripts predict credit-rating downgrades less well than scores from raw transcripts (4.7 to 4.9 against 6.1 percentage points per standard deviation) (Wu et al., 2026). Horse-race and look-ahead tests attribute the gap to lost context rather than to removed bias. Replacement names may not be neutral either. In secondary estimates from a three-model study, generated company names lower equity valuations by 0.8% to 2.6% relative to the same profile left unnamed (Garcia, 2026b). The estimated gap between names rated as easier and harder to pronounce is approximately 0.5%, and its registered tests do not establish whether this gap lies within a 1% equivalence tolerance or differs from zero.
Statistical corrections for data snooping, which address selection across many backtests, cannot detect such leakage. A planted strategy that sees tomorrow’s return passes the deflated Sharpe ratio test of Bailey and López de Prado (2014), whereas none of the strategies discovered by the LLM agents in the same study survive this test (Gençay, 2026). Membership-inference scores, which estimate whether a text was part of a model’s training data, distinguish models rather than memorized items: after within-model normalization, their areas under the receiver operating characteristic curve fall to 0.487–0.537 in seven small open models (Roy et al., 2026).
Structural remedies remove leakage by construction and show that part of the apparent predictability survives. Chronologically consistent models retain at least 54% to 62% of the apparent return predictability of news headlines (He et al., 2025). A look-ahead-free model still earns a long–short Sharpe ratio of 3.20 on headlines before trading costs (Yan et al., 2026), and frozen checkpoints scored only on outcomes after their cutoffs predict returns and fundamentals (Lehner & Lopez-Lira, 2026). However, these remedies have their own associated costs. Look-ahead-free models are small, with 1.3 billion parameters in one case (Yan et al., 2026), and poorly follow instructions relative to models trained on more data (He et al., 2025). Frozen checkpoints share few distinct cutoff dates; therefore, some tests rest on six monthly cross-sections (Lehner & Lopez-Lira, 2026).
The system audit finds uneven temporal safeguards (Table 3). Of the 295 papers, 153 evaluate only historical backtests, and 28 include forward or live tests. Among the 161 full-text studies with time-indexed tests, 73 use at least one control targeting model knowledge, and 88 use none. These controls include post-cutoff windows, forward tests, masking, and time-aware models; however, they are not equally effective. Online Resource 1 reports the breakdown by system type.
Contamination also threatens the simulations. Five price-setting designs use real historical news or episodes, while another uses real histories only in separate exogenous price backtests (Ma et al., 2025). Masking and withholding dates offer incomplete protection (Li et al., 2026b; Wang et al., 2025a; Yang et al., 2025; Zhang et al., 2026a). Endogenous prices do not ensure that decisions ignore the remembered outcomes (Zou et al., 2026). Both social-interaction ablation and a plausible simulated price path fail to measure this contamination channel. None of the full-text market studies reviewed directly estimated how far remembered outcomes moved simulated prices.
Replicating classic experiments faces a related problem, as the models may have read the original papers. One replication checks and finds that several frontier models know the 2008 experiment they are asked to reproduce, although none knows the height of its bubbles (Saxena et al., 2026). At least six others have not discussed this possibility (del Rio-Chanona et al., 2025; Henning et al., 2025; Jia & Yuan, 2024; Shah et al., 2025b; Struski et al., 2026; Tsuchihashi, 2023). Among synthetic subjects, one open model conforms to a unanimous wrong majority in 83.3% of trials when the Asch experiment is named and almost never when it is not (Bose, 2026).
7.2 Prompt sensitivity, frames, and personas#
The behavior of LLMs is frame-dependent in ways that matter for aggregation. A behavioral mapping fitted under one wording transfers poorly to a payoff-equivalent wording, with a pooled mean total variation distance of 0.349 that ranges from 0.052 for a lottery task to 0.525 for dictator and trust games (Dong et al., 2026). Small changes to a prompt can change a market. Including the word “aversion” in the prompt through which the LLM decides clients’ willingness to trade produced no client trades in 200 simulated markets, all of which collapsed early (Vidler & Walsh, 2025). Irrelevant notes from the requestor, including an unrelated number, raise the incoherence of probability forecasts (Andrews & Sarkar, 2026).
Personas are the main tool for imposing heterogeneity; however, they are poorly validated. Demographic personas built from 143 human participants neither add diversity nor move the distribution of choices in the 11–20 money-request game toward the human one (Gao et al., 2025). Once stated in the system prompt, personas lose their influence as the market context accumulates over time. In a simulated crash, the gap in cumulative drawdown between agents given the mandate once and agents reminded of it grows from 1.0 to 4.4 times across four 50-day quarters (Safder et al., 2026). Where personas shift behavior, they can produce stereotypes or swings across the entire scale rather than realistic dispersion (Section 4.1), although demographic seeding reproduced group differences in one survey study (Section 4.4).
The positive case is persona conditioning on individuals’ own records. Digital twins of 81 financial influencers, built from their public posts, agree in sign with their human counterparts’ public recommendations in 89.5% of overlapping non-neutral cases, retain account-specific structure, and, when evaluated forward, aggregate into a signal that predicts short-horizon returns (Bowles et al., 2026). Conditioning on respondents’ own survey histories raises the fit of synthetic CFO expectations from an R² of approximately 0.10 to approximately 0.40 for the same responses (Graham et al., 2026). The fit reaches 0.494 for respondents with more than three prior answers, although the synthetic panel remains under-dispersed by approximately a quarter. Heterogeneity anchored in this way can be checked against the individuals it represents.
7.3 Output variability, drift, and replicability#
Repeated outputs can vary under a fixed model configuration, and setting the temperature to zero does not guarantee determinism. Through one provider’s application programming interface (API) at temperature zero, 200 identical runs classifying the same 100 annual-report excerpts yield four distinct regression t-statistics, whereas a locally served open-weight model returns a single value (Coqueret et al., 2026). A large open model returns identical outputs in only 12.5% of runs at temperature zero, while two small models are fully repeatable (Khatchadourian & Franco, 2025). The variation reaches financial outcomes. At the default temperature, about 5% of repeated runs of one textual-analysis design produce a tone coefficient significant at the 10% level by chance alone (Coqueret et al., 2026). Across three repetitions of one headline-sentiment strategy driven by LLaMA-2-7B, the standard deviation of total return rises from 0.25 to 2.72 percentage points as temperature rises from 0 to 1, whereas with GPT-3.5 it stays near 0.9 (Yu, 2023). According to its abstract, runs of one multi-agent trading system under varied sampling settings return 18.1% ± 2.8% with one backbone and 15.8% ± 4.2% with another, against 19.1% for buying and holding the stock (Koviazin et al., 2026).
Models change over time. Rerunning identical designs six months apart produces small but statistically significant drift for several models (Gao et al., 2025), and successive releases differ more, as the loss-aversion estimates along one provider’s lineage in Section 4.2 show (Wang et al., 2025d). However, only 58 of the 219 primary studies that were read in full provide a dated snapshot for at least one model. Papers change as well. One detection study’s revised version withdraws the portfolio claims of its first version (Roy et al., 2026), and two other corpus papers have been withdrawn by their authors from arXiv (Kim et al., 2024; Yang et al., 2026b). Credible building blocks therefore require dated configurations, raw outputs, and distributions over repeated draws, which the reporting standards proposed in this literature require or recommend (Coqueret et al., 2026; Khatchadourian & Franco, 2025; Wang et al., 2025c).
7.4 Hyper-rationality and the human benchmark#
Human-likeness depends on the comparator, and a human comparator is necessary only for claims about human fidelity. Of the 271 primary studies, 147 reported no human comparator in the material read (134 of them read in full), but only 10 of these 147 claimed a human-surrogate role. Of the 93 studies that claimed this role, 80 compared with human data: 33 with published values, 30 with a prior matched dataset, 14 with participants in the same study, and 3 with an external survey. Of the remaining 13, 10 reported no comparison (one coded from its abstract), and 3 could not be classified. The 44 comparisons with same-study participants or a prior matched dataset used matched human data, whereas published values may come from a different design or offer only summary statistics. Twenty-two studies compared the dispersion of behavior with human data, and six validated a calibration on held-out human behavior. These counts record comparisons made, not successful validations, and the coding of a surrogate role partly reflects a study’s aim to compare with humans. Comparators range from lay adults (Powdthavee, 2026) and undergraduates (Bertomeu et al., 2026) to advisers surveyed a decade earlier (Rumpf et al., 2026) and laboratory professionals (Hansen & Lee, 2025), so a claim of superiority requires specifying both population and task.
Calibrating LLM agents to human behavior can shift parameters; however, validity beyond the calibration task requires separate evidence. Of several alignment techniques, only fine-tuning GPT-4o on human data from the same game yielded a distribution that the study’s test did not distinguish from the human one in the 11–20 money-request game (Gao et al., 2025). Failing to detect a difference, however, does not establish equivalence or transfer to other tasks. Investor-profile prompts move all eight measured bias parameters in the predicted direction, pushing loss aversion from 1.12 to 3.00 against a human benchmark of 2.25 (Yee & Koh, 2026). However, they leave the disposition ratio, for which 1 means no effect, about 87% below the human benchmark, and fail adversarial checks for representativeness. When the prompt-calibrated extrapolation parameter is applied to a rule-based market, it generates a short-horizon momentum of 0.18, compared to an empirical value of 0.14, whereas the human-calibrated parameter of 0.12 aligns more closely with the empirical value (Yee & Koh, 2026). Fine-tuning can work out-of-sample, but its target determines what it delivers. Training on theoretical solutions that are statistically consistent with investors’ choices reduces the error against real participants’ choices by 44.52% to 61.26%, including two held-out problems (Wang et al., 2025b), whereas training on rational-expectations targets eliminates the human-like overreaction that the base model reproduces (Gao et al., 2026a).
Explanations for hyper-rationality remain contested. Alignment can increase risk aversion (Ouyang et al., 2025) and introduce biases (Itzhak et al., 2024), while reasoning can linearize probability weighting (Hintze et al., 2025), with one abstract reporting risk-neutral expected-value behavior in the absence of personas (de Castro Soares et al., 2026). Greater capability also moves beliefs and preferences in different directions (Bini et al., 2026).
The measured bias also depends on what the model is told about human behaviors. After reading an abstract that reported a loss aversion coefficient of 1.96, ChatGPT’s measured coefficient was 1.785, and after reading one reporting 1.07, it was 1.043 (Yechiam & Tarabeih, 2026). In a related design, its loss aversion follows the reported human bias, whether the human sample numbered 10,583 or 43 people. Therefore, the measured “bias” can reflect what a model has read or been shown rather than a stable disposition. When humans join machines in a repeated game, the framing effects observed among machines alone weaken and change (Engel et al., 2025). Hyper-rationality is better understood as a property of a configuration under an instrument than as a trait that transfers to the markets.
7.5 Evaluation practice and the inferential unit#
In audits that re-run published LLM trading systems over later or longer windows or with realistic costs, the reported gains shrink or disappear (Li et al., 2025b; Li et al., 2026a; Ye et al., 2026). Re-running two published trading agents over a later one-year window with commissions, token costs, spreads, and market impact lowers TradingAgents’ portfolio Sharpe ratio from 0.43 gross to 0.22 net and QuantAgent’s from −0.96 to −1.15, leaving both below buying and holding (Ye et al., 2026). The same audit found that 35 of the 40 system-by-friction cells across five published systems were not modeled at all. In the audit for this review, 68 of the 140 full-text system papers that evaluate an implementable trading or investment strategy model trading costs, or 62 if six partial treatments are excluded (Table 3). Another audit recovers at least partial cost treatment for 14 of the 30 trade-relevant studies (Yao et al., 2026). In its demonstration with simple rules, replacing same-close execution without costs by next-close execution with costs of 10 basis points cuts a high-turnover strategy’s final equity multiple from 27.38 to 1.50. Only 26.8% of the 164 main-conference papers acknowledge look-ahead bias, and 1.2% acknowledge survivorship bias (Kong et al., 2026).
Broader tests reinforce this concern. Only one of 32 LLM-written strategies claiming an edge delivers it (Tian et al., 2026); seven of ten backbones in an otherwise identical trading system do not pay for themselves (Duan et al., 2026). Long-window, survivorship-free retests challenge published alpha claims (Li et al., 2026a), masking produces negative selection alpha for nine of ten agents (Zhu et al., 2026), and frontier models lose real money in one prediction-market test (Zhang et al., 2026b).
Call-level replication answers a narrower question than population-level replication. Many experiments treat each call to one model as an independent subject (Gao et al., 2025; Wang et al., 2025c; Yechiam & Tarabeih, 2026; Yee & Koh, 2026), which can estimate variation conditional on that configuration but does not establish heterogeneity across humans or independently sampled model configurations. Normalized standard deviations of 0.054 and 0.030 for two frontier models, against 0.231 for humans, show how compressed within-configuration variation can be relative to human dispersion (Wang et al., 2025c). Market studies rest on a few independent markets, such as three per model in the most carefully benchmarked replication (Henning et al., 2025) and, on a 100-agent platform, a single headline run with three runs per backbone in a robustness check (Yang et al., 2025). Where runs are replicated, stylized-fact estimates vary with relative standard deviations of up to 63% (Yang et al., 2025), and agent rankings do not survive a rerun (Li et al., 2026b). For simulation claims about aggregate outcomes, independently repeated markets or sessions provide replication; agents interacting within one market do not provide independent market observations.
8 Conditions for credible aggregation#
The evidence in Sections 4 to 7 supports five proposed criteria for assessing whether individual LLM decisions provide credible building blocks for models of market interaction. Each addresses a documented failure; together, they guide validation rather than constitute a proven sufficiency test. Table 5 lists each condition and reports how many of the 30 price-setting designs document each of its components. This audit examines designs where agents set prices, while Section 6.3 discusses interactions through payoffs and networks, such as bank runs. Table 6, discussed after the five conditions, states what each of the five common claims requires.
First, observe the outcomes that arise from the interaction. Averaged expectations can track survey means (Bybee, 2023; Graham et al., 2026), and pooled digital-twin signals can predict returns (Bowles et al., 2026) without showing behavior when agents move prices. A rule measured among copies of one model can also change when the other agents differ (Section 6.4). Institutions can reverse model rankings even with agents and payoffs fixed (Chupilkin, 2026).
Second, measure heterogeneity and dependence. Surrogate populations require validation against relevant human populations, and participant populations require defensible representations of the deployed configurations. The three market studies that compare dispersion with same-design human data reach different verdicts (Section 6.1), and a comparison is a test, not a pass. Initializing traits from investor records (Yang et al., 2025) does not establish a validated population.
The five dependence studies measured different objects: error diagnostics in two, action correlation or overlap in two, and holdings overlap and common buying in one (Section 6.5). Where outcomes permit, designs should report error covariance, alongside mean bias and individual variance. Effective agent counts require the averaging assumptions stated above. Human histories, mixed families, and epistemic roles are candidate interventions whose effects need validation, rather than automatic solutions to dependence.
Third, specify the information environment and exclude remembered outcomes. Higher-order information demands (Galanis, 2026), shared narratives (Ross et al., 2026), and networked rumors (Yang et al., 2025) change the aggregation process. Researchers should identify shared inputs and use synthetic environments or appropriately time-restricted models when replaying actual events. Five price-setting designs use historical news or episodes, and only one replication checks for familiarity with the original experiment (Section 7.1).
Fourth, justify or vary the institution and include a non-LLM baseline under the same rules whenever the claim is that the LLM component explains outcomes. Random or heuristic agents can reproduce important market outcomes (Gode & Sunder, 1993; Ruano & Rajan, 2026), so realism alone does not identify the LLM component’s explanatory contribution. A baseline is not needed to show that a specified LLM population differs from humans under a matched design or to describe what a deployed fleet did. Only four of the 30 designs include non-LLM agents under the same rules, and 20 compare with theory or equilibrium; an equilibrium prediction is not an interacting counterfactual population.
Fifth, match validation to the claim and replicate it at the level of the claim. Surrogate claims require a human benchmark under the same design, and simulation claims require independent repeated markets. Table 5 shows how unevenly they are documented. Claims drawn from production records, such as a live fleet (Barton et al., 2026b), require scrutiny of the sampling frame, exposure definitions, comparison group, and timing. Such scrutiny supports the description of observed behaviors and exposures. Estimating the effects on prices or stability additionally requires a credible counterfactual and a design that addresses selection into exposure and feedback between adoption and outcomes. Performance claims for decision tools likewise require time-consistent evaluation that keeps future information out of model knowledge, retrieval, data preparation, and execution. Controlled synthetic tasks can test mechanisms or capabilities but do not by themselves establish performance in actual markets. Online Resource 1 records the source-level evidence and uncertainty for each component, while Online Resource 2 contains the audit notes.
Table 6 presents the criteria in a decision path. The five criteria describe credible aggregation evidence as a whole; Table 6 identifies the parts of them that a given claim cannot do without. The first step is to state the claim: that an LLM population reproduces a human market outcome, that the LLM component explains outcomes beyond simpler agent rules, that configured or deployed agents behave in documented ways or change outcomes, that a decision tool performs, or that an instrument measures a construct. The second step is to identify the comparison, controls, and replication that the claim requires; diagnostics, such as dependence measures, and documentation, such as dated identifiers and prompts, then help to judge the evidence. A study can support one claim and not another; therefore, no single score can summarize it.
Online Resource 1 reports a source audit of all 12 coded components for each of the 30 price-setting designs. The audit checks documentation rather than certifying validity: a reported test may fail, a published prompt may fail to recover a retired model, and an unreported run count does not establish more than one run. It distinguishes same-design human comparisons using published summaries from re-analyzing original human observations.
Table 5 reports the adopted codes, including the two corrections from the source adjudication described in Section 2.3. Its conclusions survive alternative treatments of uncertain codes (see the table note). These scenarios test the sensitivity to uncertain codes, not the accuracy of positive codes, the component definitions, or search recall. Under every treatment, no study that compared agent dispersion with human data included non-LLM agents under the same rules. Because explanatory claims are not coded, this empty intersection marks a design missing from the selected set rather than a measured failure of studies that claim both human fidelity and an explanatory contribution of the LLM component. For studies making both claims, the open task is the joint validation of the population and its incremental contribution to market outcomes, rather than further isolated demonstrations.
Table 5 Conditions for credible aggregation and their documentation among the 30 price-setting designs
| Condition | Requirement | Documented among the 30 designs (unknown in parentheses) | Illustrative designs |
|---|---|---|---|
| 1. Interaction | Aggregate outcomes arise from agents’ interaction through prices, payoffs, or networks | 30 of 271 primary studies (4 of them also elicit decisions independently); 215 elicit decisions independently | Henning et al. (2025); Chupilkin (2026); Saxena et al. (2026) |
| 2. Heterogeneity | Sources of heterogeneity stated; heterogeneity validated for the claimed role; dependence reported; effective agent count when averaging assumptions apply | 3 compare between-agent dispersion with human markets of the same design (2 unknown), 1 finding similar dispersion; 1 initializes traits from investor records; 14 homogeneous by design; 5 measure dependence (2 unknown; errors in 2, action correlation or overlap in 2, holdings and common buying in 1) | Begin et al. (2026); Saxena et al. (2026); outside the 30: Feng et al. (2025) |
| 3. Information | Information structure stated; shared inputs identified; remembered outcomes excluded | 5 feed agents real news or replay real episodes (2 unknown); none of the 28 read in full measures the effect of remembered outcomes on prices; 1 of 9 replications checks whether models know the original design (2 designs unknown) | Gao et al. (2024); Lin (2025); Galanis (2026) |
| 4. Institutions | Institution varied or justified; non-LLM baseline under the same rules when the LLM’s explanatory contribution is claimed | 4 vary the auction or trading mechanism (2 unknown); 4 include non-LLM agents under the same rules (2 unknown); 20 compare with a theoretical or equilibrium prediction | Shah et al. (2025b); Chupilkin (2026); outside the 30: Ruano and Rajan (2026) |
| 5. Validation | Human benchmark matched to the claim; market as the unit of replication; dated configuration, prompts, and raw outputs | 1 runs same-design human markets; 5 compare with published same-design human evidence, including summary statistics (2 unknown); 19 report repeated markets or runs (10 unknown, 1 not applicable); of the 28 read in full, 12 name a dated identifier for at least one model and 17 state that full prompts are published (documentation indicators) | Henning et al. (2025); Galanis (2026); outside the 30: Coqueret et al. (2026) |
Note: Counts describe the 30 price-setting designs, unless another denominator is stated. “Not documented” means not established in the material examined. A dispersion comparison is counted regardless of its result; dependence measures need not be error correlations. Non-LLM baselines require agents to operate under the same rules. A same-design human comparison sets agents’ outcomes against quantitative human outcomes under the same core task, institution, and payoffs; published summary statistics are distinguished from analysis of the original data. Dispersion comparisons concern dispersion between agents, not pooled response frequencies, and mechanism variation includes whether a market maker updates its price. Online Resources 1 and 2 provide the study membership, definitions, locators, and audit qualifications. Illustrative studies need not satisfy every criterion. Treating uncertain absences as unknown lowers no positive count (by construction), and admitting the four boundary readings adds at most two to any count (Online Resource 1, sheet “Coverage sensitivity”). The repeated-run count includes T. Gao et al. (2026), whose ten run-level results do not document independent resets or seeds; this code remains uncertain. Row 1 counts price-setting designs only; the interaction through payoffs or networks is discussed in Section 6.3.
Table 6 Evidence required for common aggregation claims
| Claim | Necessary comparison | Necessary controls and replication | Useful diagnostics | Documentation that supports assessment |
|---|---|---|---|---|
| Human surrogate: an LLM population reproduces a human market outcome | A human benchmark under the same design, concurrent or published, on the outcome claimed; agreement on the distributional features the claim relies on, not merely similar dispersion | Remembered outcomes excluded; familiarity with a replicated design checked; independently repeated markets | Dependence relative to humans; stability across wordings and versions; non-LLM agents under the same rules | Dated model identifiers, full prompts, raw outputs |
| Explanatory value: the LLM component explains outcomes beyond simpler agent rules | Non-LLM agents (random, heuristic, or rule-based) under the same institution and information | Independently repeated markets | Ablations of LLM-specific features, such as reasoning, memory, or personas; dependence among agents | Rules of the baseline agents; configuration of the LLM agents |
| AI economic participant: configured or deployed LLM agents behave in documented ways or change market outcomes | Simulations: the configurations represented and varied, such as models, prompts, interfaces, and LLM shares. Production records: a defined population and observation window; a comparison group for relative claims and a credible counterfactual for effects on prices or stability | Simulations: remembered outcomes excluded when real episodes are replayed; independently repeated markets. Production records: sampling frame, exposure definitions, and timing; for effects, a design addressing selection into exposure and feedback between adoption and outcomes | Dependence in errors, actions, and holdings; human-likeness not required | Configuration surfaces and dated identifiers of the deployed agents |
| Financial decision tool: a system performs in markets | Baseline strategies under the same rules, net of frictions | Time-consistent evaluation that keeps future target information out of model knowledge, retrieval, data preparation, and execution, through a defensible post-cutoff test or an appropriately time-restricted model; repeated runs; relevant implementation frictions, including price impact when performance depends on prices that other agents move | Dependence when many copies are deployed | Test window, cost model, code |
| Experimental instrument: an LLM-based measure captures a construct | Meaning-preserving alternative wordings; a market-level observation when the construct is market-level | Remembered outcomes excluded; repeated runs and dated model versions | Sources of variation stated; varied institutions when the construct depends on them | Dated versions, prompts, raw outputs |
Note: The necessary evidence depends on the claim rather than the agent’s role alone, and a study may make multiple claims. Online Resource 1 lists, for each of the 30 price-setting designs and each claimed role, the necessary components that are documented, not documented, or unknown; it reports no summary scores. Whether a study claims explanatory value is not coded; therefore, the non-LLM baseline is reported for every design. Documentation indicators support assessment but do not establish validity, and the real-news indicator records exposure, not contamination. The requirements that the coding does not record, such as institutional justification, time-consistent and net-of-friction performance, credible counterfactuals for the effects of deployed agents, and version stability, are discussed in the text rather than counted. Online Resource 2 lists the component rules and their corresponding limits.
9 A research agenda#
The evidence suggests eight priorities, ordered from establishing comparable measurements and documented configurations, through testing whether measured population differences survive interaction under fixed and varied institutions and information, to human participation and live market exposure.
First, common estimands would separate configuration effects from instrument effects. A shared financial-task battery should compute the same disposition, anchoring, extrapolation, loss aversion, and probability-weighting statistics using multiple instruments, payoff-equivalent wordings, and dated releases. Wording sensitivity and model drift imply distributions rather than single calibration values (Dong et al., 2026; Gao et al., 2025; Wang et al., 2025d).
Second, reporting standards should be adopted. GUIDE-LLM covers roles, configurations, inputs, validation, reproducibility, and interests (Feuerriegel et al., 2026). Finance-specific work adds exact versions, query dates, prompts, generation settings, invalid response handling, and raw outputs (Coqueret et al., 2026; Wang et al., 2025c), along with temporal integrity, implementation costs, and internal agent disaggregation (Kong et al., 2026; Ye et al., 2026). Reporting enables assessment but does not validate simulations. Aggregate claims also require repeated markets and sessions.
Third, for surrogate populations, individual histories offer a route to testable heterogeneity; reserve prices, survey answers, and public posts can anchor agents to identifiable human behavior (Bowles et al., 2026; Feng et al., 2025; Graham et al., 2026). Populating markets from matched human panels and comparing joint outcomes extends the same-design laboratory approach of Henning et al. (2025).
Fourth, dependence studies should measure covariance, marginal accuracy, and mean bias jointly, with explicit model and task populations and a justified independence baseline (Jo et al., 2026). Order-level herding statistics from empirical finance (Lakonishok et al., 1992; Sias, 2004) would make the action dependence of LLM agents comparable with that of institutional investors. Mixing families, post-training, or information can alter these aspects. Holding institutions fixed while measuring these changes would help separate dependence from individual errors and test algorithmic-monoculture predictions in financial settings (Kleinberg & Raghavan, 2021). Varying the share of each model within a market while recording every agent’s forecasts would also separate the initial disagreement from adaptation during the interaction (Saxena et al., 2026).
Fifth, contamination requires market outcome testing. Paired simulations using standard and time-restricted models (Benhenda, 2026; Yan et al., 2026) or real and counterfactual episodes (Bose, 2026) could test whether remembered outcomes affect simulated prices, provided capability, training, and information differences are held fixed or separately identified.
Sixth, institutions, assets, and the operating layer of deployed agents should be treated as experimental variables. Only four of the 30 price-setting designs vary the auction or trading mechanism (Chupilkin, 2026; Hansen & Lee, 2025; Shah et al., 2025b; Tsuchihashi, 2023). At least seven let agents trade more than one asset (Barton et al., 2026b; Gao et al., 2024; Li et al., 2026b; Lin, 2025; Ma et al., 2025; Yang et al., 2025; Zhang et al., 2026a), and several prohibit short selling (Lin, 2025; Lopez-Lira, 2025; Maresca, 2026). Real markets differ in price limits, auction formats, short-sale constraints, and market-making obligations, and these rules may interact with correlated LLM order flows in ways that single-asset laboratory designs cannot. The configuration surfaces of deployed agents are a further treatment. In one of the two deployed fleets, a risk slider sets leverage, and the list of assets displayed to the agent routes its selection (Barton et al., 2026b); thus, interface and configuration design are policy variables that experiments can manipulate.
Seventh, mixed human–LLM markets matter because they test substitution and participation. The corpus includes small mixed auctions: in one auction arena in the system audit, a human player bids against two LLM agents, and the highest bid sets each price (J. Chen et al., 2024). No study in the synthesis set runs a controlled asset market in which human and LLM traders jointly set prices, and Magar’s (2026) abstract describes a platform for such markets but reports no results from one. Human–machine games show that framing changes when humans join (Engel et al., 2025), whereas production venues contain other participants who are not characterized (Barton et al., 2026b). Varying the LLM share among human traders and extending the noise-trader design of Ross et al. (2026) would test both agent behavior and human responses.
Finally, follow the advice through trades and prices. Model choice strongly shapes advice for a fixed household (Bäckman, 2026), and firms receiving buy recommendations have higher ESG scores after AI use is detected in the recommending analysts’ reports (Li & Yu, 2025). Linked platform data or field experiments could establish whether shared advice generates common exposures and has subsequent market effects.
10 Limitations#
This review provides a dated evidence map and narrative synthesis of when individual LLM decisions support market-level conclusions. However, it has five limitations.
First, SSRN retrieval likely under-represented finance working papers relative to computer science preprints, and recall was not formally estimated. A check of the reference lists of the three closest reviews found nine LLM-based financial systems that the search did not retrieve, eight of them cited by Khoukhi and Slimani (2026), who searched Scopus and Web of Science. None is a market simulation; if eligible, they would enter the system audit rather than the price-setting designs (Online Resource 1, sheet “Review reference check”). Because 80 of the 602 retained records came from routes after the three search arms, and because the system audit did not code price formation, counts of rare designs, such as the single study that runs same-design human markets, may understate the evidence that exists. The system audit holds at least one price-setting design outside the 30, the mixed human–LLM auction discussed in Section 9. Second, although abstract-based claims are marked, reading depth varies: 48 of 276 synthesis records rely on abstracts and six on metadata, 75 of 295 system-audit records likewise lack full-text coding, and corpus counts include these records.
Third, the extraction relied on one LLM coding pass per paper. Three checks followed: separate agents verified the claims, a model from another developer audited all 360 components of the 30 price-setting designs against their sources, and the author validated the results reported before the October 9, 2026 update against the evidence files (Section 2.3). None of these checks, including the cross-model recoding, is blind double coding by independent humans, and none yields an inter-rater reliability statistic. Facets that require judgment therefore remain vulnerable to error. Errors do occur: of the seven component disagreements that could raise a reported count, source adjudication corrected two, and the remaining disagreements, nearly all in facets, were not adjudicated. The component counts are robust to the alternative treatments of uncertain codes examined in Section 8; however, these treatments cannot test whether the positive codes are correct. The review’s own instruments also fall short of the Table 6 documentation standard for LLM-based measurement: model identifiers are undated aliases, sampling settings were not recorded, and task prompts are available only on request.
Fourth, the corpus will age quickly: 278 of its 599 papers appeared between January 1 and September 27, 2026, and 350 are working papers whose results may change. Findings about named models may not transfer to their successors. Finally, the framework and five criteria were not tested as predictions. Effect sizes were not pooled because studies sharing a behavioral label usually measure different outcomes.
Despite these limitations, the strongest conclusions concern the documented imbalance between individual and market evidence in the synthesis and the need to distinguish the validation targets. Blind human double coding of a random subsample could estimate inter-rater reliability; a targeted search of SSRN, Scopus, Web of Science, and studies citing the replicated experiments could test recall; improved repository access could reduce coverage gaps; and common estimands with variance reporting could support the quantitative synthesis. None of these eliminates the need to validate the link between decisions and market outcomes.
11 Conclusion#
Individual LLM decisions support market-level conclusions only when their measurements, population composition, information, and interaction are validated for the intended claim. This review proposes five criteria: (1) endogenous interaction; (2) measured heterogeneity and dependence; (3) protection from remembered outcomes; (4) explicit institutions and, where the LLM’s contribution is claimed, non-LLM benchmarks; and (5) validation at the appropriate level of replication. The criteria a study needs depend on the claim it makes.
Across the three decision levels, behavior depends on configuration and instruments, internal pipelines shape how judgments become orders, and institutions mediate the aggregate effect of those orders. Changing a model, the mix of models, or a trading rule can change whether a market converges or bubbles, and a model that forecasts the fundamental among its own kind can switch to trend following among bubble-forming agents. However, the evidence behind these market-level statements is thin: only 30 of the 271 primary studies in the synthesis let agents’ decisions set prices, and only one of those ran human markets under the same design.
Dependence among agents is a plausible additional channel, but the few studies that measure it use different statistics, and similar common forecast errors in human and LLM bubble markets caution against treating it as uniquely artificial (Saxena et al., 2026). Shared errors do not necessarily disappear as agents are added; their market effect depends on how institutions weigh decisions and feed outcomes back into their behavior. Measuring covariance alongside bias and accuracy would make this mechanism testable without inferring systemic harm from common actions. Until then, the market consequences of dependence relative to individual bias remain unmeasured in a common design.
The evidence carries different implications for those who study LLM agents and those who deploy or oversee them. For researchers, the immediate priorities are dated configurations, repeated markets, and validation of the population relevant to the claim, including how its members respond to one another; human-surrogate and AI-participant research can inform each other, but each retains its own standard of validity. For regulators and deploying institutions, shared models, interfaces, and advice are candidate sources of common exposure whose effects on liquidity, volatility, and price efficiency remain to be measured. Performance claims also deserve time-consistent evaluation net of frictions, because controlled synthetic tasks alone do not establish performance in live markets. In each case, the question is the same one this review has posed throughout: not whether an LLM makes a given decision, but whether that decision, aggregated through a population and an institution, can be trusted to say anything about a market.
Supplementary information#
Online Resource 1 - ESM_1.xlsx: Extraction workbook, bibliographic verification and screening records, coding protocols, evidence tables, and component-level audit with sensitivity scenarios.
Online Resource 2 - ESM_2: Detailed review methods, extended evidence, coding definitions, and qualifications to numerical comparisons.
Online Resource 3 -ESM_3.zip: Scripts, execution instructions, and expected outputs for reproducing the review’s counts, tables, figures, sensitivity scenarios, and agreement statistics.
Statements and Declarations
- Funding
- No funding was received for conducting this study.
- Competing interests
- The author has no relevant financial or non-financial interests to disclose.
- No funding was received for conducting this study.
- The author has no relevant financial or non-financial interests to disclose.
- Not applicable.
- The data analyzed during this study are included in this published article and its supplementary information files, except the agents’ per-paper working files and the task prompts of individual agent runs, which are available from the author on reasonable request. Online Resource 1 provides the 599-paper corpus with bibliographic verification records, search and exclusion ledgers, coding protocols, consolidated synthesis and system-audit tables, and the source audit of 12 components for each of the 30 price-setting designs, with their counts under alternative treatments of uncertain codes, the cross-model comparison, and the dated record of its source adjudication. It records evidence locators, assessable denominators, and access limitations for the study. Online Resource 2 provides extended methods, system descriptions, comparative evidence, and coding definitions condensed from the main text.
- Online Resource 3 contains the scripts that reproduce the corpus counts, evidence tables, figures, coverage-sensitivity scenarios, and cross-model agreement statistics from Online Resource 1, along with an execution guide. The scripts recompute these results from the recorded codes; they do not rerun the searches or reproduce the agents’ coding judgments. The task prompts of the retained agent runs are available from the author upon request.
- During the preparation of this work, the author used Claude (Anthropic, Opus 5.5) to help edit the author's manuscript text for clarity and concision, check each section's claims against its sources, and write the scripts that produce the figures. The author also used GPT-6 Sol (OpenAI) to review the manuscript, identify omissions, and verify sources. Codex also recoded a stratified sample of studies for a cross-model check and adjudicated the resulting count-relevant disagreements against the sources. These models' use as agents in the search, screening, extraction, bibliographic verification, and coding of the reviewed literature is part of the review's methodology and is documented in Section 2.3 and Online Resource 2. The author reviewed and edited all AI-assisted output as needed and takes full responsibility for the published article. The author manually validated the results reported in the manuscript against the underlying sources and evidence files, except where Online Resource 2 documents otherwise.
References
- Agliata, N., & Hasso, T. (2026). Generative AI as an Investment Advisor: Same Client, Different Advice. FinTech, 5, 54. https://doi.org/10.3390/fintech5020054
- Agrawal, K., Teo, V., Vazquez, J. J., et al. (2025). Evaluating LLM Agent Collusion in Double Auctions (arXiv:2507.01413). arXiv. https://arxiv.org/abs/2507.01413
- Andrews, I., & Sarkar, S. (2026). Dutch Books for Language Models (arXiv:2609.02797). arXiv. https://arxiv.org/abs/2609.02797
- Apte, M. (2026). Do LLM Trading Agents Herd? A Market Microstructure Stress Test. In 2026 IEEE Symposium on Computational Intelligence for Financial Engineering and Economics (CIFEr) (pp. 61–66). IEEE. https://doi.org/10.1109/cifer67845.2026.11692423
- Arksey, H., & O’Malley, L. (2005). Scoping studies: towards a methodological framework. International Journal of Social Research Methodology, 8, 19–32. https://doi.org/10.1080/1364557032000119616
- Axtell, R. L., & Farmer, J. D. (2025). Agent-Based Modeling in Economics and Finance: Past, Present, and Future. Journal of Economic Literature, 63, 197–287. https://doi.org/10.1257/jel.20221319
- Bäckman, C. (2026). One advisor for the whole world? Cross-country evidence on financial advice from large language models (SAFE Working Paper No. 490). https://hdl.handle.net/10419/343061
- Bailey, D. H., & López de Prado, M. (2014). The Deflated Sharpe Ratio: Correcting for Selection Bias, Backtest Overfitting, and Non-Normality. The Journal of Portfolio Management, 40, 94–107. https://doi.org/10.3905/jpm.2014.40.5.094
- Barton, T. J., Constantakis, C., Hauseman, P., et al. (2026a). Operating-Layer Controls for Onchain Language-Model Agents Under Real Capital (arXiv:2604.26091). arXiv. https://arxiv.org/abs/2604.26091
- Barton, T. J., Constantakis, C., Hauseman, P., et al. (2026b). What LLM Trading Agents Actually Do in Production: A Six-Month, Population-Scale Record from Two Fleets (arXiv:2609.05663). arXiv. https://arxiv.org/abs/2609.05663
- Basu, A., & Chakraborty, P. (2026). When Names Change Verdicts: Intervention Consistency Reveals Systematic Bias in LLM Decision-Making (arXiv:2603.18530). arXiv. https://arxiv.org/abs/2603.18530
- Batra, D., Hamill, C., Hartley, J., et al. (2025). A Review of LLM Agent Applications in Finance and Banking (SSRN Working Paper 5381584, version posted August 14, 2025). https://doi.org/10.2139/ssrn.5381584
- Begin, J., Gho, B., Muppavarapu, S., et al. (2026). Preference Optimization Drives Monoculture in LLM Prediction Markets (arXiv:2606.26583). arXiv. https://arxiv.org/abs/2606.26583
- Benhenda, M. (2026). Look-Ahead-Bench: a Standardized Benchmark of Look-ahead Bias in Point-in-Time LLMs for Finance (arXiv:2601.13770). arXiv. https://arxiv.org/abs/2601.13770
- Bertomeu, J., Cheynel, E., Lunawat, R., & Milone, M. (2026). On humans and AI: A financial reporting dilemma (MPRA Paper No. 128775). https://mpra.ub.uni-muenchen.de/128775/
- Bhagwat, V., Cookson, J. A., Dim, C., & Niessner, M. (2025). The Market’s Mirror: Revealing Investor Disagreement with LLMs (SSRN Working Paper 5375473, draft of July 2025). https://doi.org/10.2139/ssrn.5375473
- Biancotti, C., Camassa, C., Coletta, A., et al. (2025). Chat Bankman-Fried: an Exploration of LLM Alignment in Finance (arXiv:2411.11853v3). arXiv. https://arxiv.org/abs/2411.11853v3
- Bikhchandani, S., & Sharma, S. (2001). Herd behavior in financial markets. IMF Staff Papers, 47, 279–310. https://www.imf.org/external/pubs/ft/staffp/2001/01/pdf/bikhchan.pdf
- Bini, P., Cong, L. W., Huang, X., & Jin, L. J. (2026). Behavioral Economics of AI: LLM Biases and Corrections (arXiv:2602.09362). arXiv. https://arxiv.org/abs/2602.09362
- Borjigin, Y., Hermann, A., Cyron, C., & Aydin, R. (2026). AnchorBench: A Multi-Pathway Benchmark for the Anchoring Effect in LLMs (arXiv:2608.14320). arXiv. https://arxiv.org/abs/2608.14320
- Bose, J. (2026). Recognition, Simulation, and Refusal: A Contamination-Aware Study of Classic Psychological Effects in LLM Agents (arXiv:2609.22090). arXiv. https://arxiv.org/abs/2609.22090
- Bowles, B., Duch, R. M., & Sorescu, S. M. (2026). Talking to Digital Twins: Selective Disclosure and Belief Measurement in Financial Social Media (arXiv:2608.01181). arXiv. https://arxiv.org/abs/2608.01181
- Brock, W. A., & Hommes, C. H. (1998). Heterogeneous beliefs and routes to chaos in a simple asset pricing model. Journal of Economic Dynamics and Control, 22, 1235–1274. https://doi.org/10.1016/s0165-1889(98)00011-6
- Buchanan, J., & Foster, J. (2026). The Innate Economic Preferences of Language Models (arXiv:2607.26288). arXiv. https://arxiv.org/abs/2607.26288
- Bybee, L. (2023). Surveying Generative AI’s Economic Expectations (arXiv:2305.02823v2). arXiv. https://arxiv.org/abs/2305.02823v2
- Calvano, E., Calzolari, G., Denicolò, V., & Pastorello, S. (2020). Artificial Intelligence, Algorithmic Pricing, and Collusion. American Economic Review, 110, 3267–3297. https://doi.org/10.1257/aer.20190623
- Cartea, Á., Chang, P., Chen, N., & Zhong, M. (2026). AI Bubbles with Large Language Models (SSRN Working Paper 6426761). https://doi.org/10.2139/ssrn.6426761
- Chaboud, A. P., Chiquoine, B., Hjalmarsson, E., & Vega, C. (2014). Rise of the Machines: Algorithmic Trading in the Foreign Exchange Market. The Journal of Finance, 69, 2045–2084. https://doi.org/10.1111/jofi.12186
- Chen, J., Yuan, S., Ye, R., Majumder, B. P., & Richardson, K. (2024). Put Your Money Where Your Mouth Is: Evaluating Strategic Planning and Execution of LLM Agents in an Auction Arena (arXiv:2310.05746v4). arXiv. https://arxiv.org/abs/2310.05746v4
- Chen, S., Green, T. C., Gulen, H., & Zhou, D. (2024). What Does ChatGPT Make of Historical Stock Returns? Extrapolation and Miscalibration in LLM Stock Return Forecasts (arXiv:2409.11540). arXiv. https://arxiv.org/abs/2409.11540
- Chen, Y., Liu, T. X., Shan, Y., & Zhong, S. (2023). The Emergence of Economic Rationality of GPT (arXiv:2305.12763v3). arXiv. https://arxiv.org/abs/2305.12763v3. Published version: Proceedings of the National Academy of Sciences 120(51):e2316205120 (2023). https://doi.org/10.1073/pnas.2316205120
- Cheng, G., Jin, H., Zhang, W., et al. (2026). Learning to Conceal Risk: Controllable Multi-turn Red Teaming for LLMs in the Financial Domain (arXiv:2509.10546v2). arXiv. https://arxiv.org/abs/2509.10546v2. Published version: Proceedings of the 64th Annual Meeting of the Association for Computational Linguistics (Volume 1: Long Papers), pp 41005–41020 (2026). https://doi.org/10.18653/v1/2026.acl-long.1903
- Chupilkin, M. (2026). Artificial Institutions: How Institutional Design Shapes LLM Simulations (arXiv:2608.04020). arXiv. https://arxiv.org/abs/2608.04020
- Cook, T. R., & Kazinnik, S. (2025). Social Group Bias in AI Finance (arXiv:2506.17490). arXiv. https://arxiv.org/abs/2506.17490
- Coqueret, G., Llull, J., Oswald, F., et al. (2026). Randomness in large language models: What researchers need to know (and report) (arXiv:2607.24372). arXiv. https://arxiv.org/abs/2607.24372
- Csaszar, F. A., Peterson, A., & Wilde, D. (2026). The Strategic Foresight of LLMs: Evidence from a Fully Prospective Venture Tournament (arXiv:2602.01684). arXiv. https://arxiv.org/abs/2602.01684
- Daníelsson, J., Macrae, R., & Uthemann, A. (2022). Artificial intelligence and systemic risk. Journal of Banking & Finance, 140, 106290. https://doi.org/10.1016/j.jbankfin.2021.106290
- de Castro Soares, D., de Freitas Bittencourt, L. E. B., & Tessmann, M. S. (2026). Rationality and financial risk aversion in large language models: Evidence from a multi-model Holt–Laury experiment. Journal of Behavioral and Experimental Finance, 51, 101235. https://doi.org/10.1016/j.jbef.2026.101235
- del Rio-Chanona, R. M., Pangallo, M., & Hommes, C. (2025). Can Generative AI agents behave like humans? Evidence from laboratory market experiments (arXiv:2505.07457). arXiv. https://arxiv.org/abs/2505.07457
- Dong, T., Kunievsky, N., & Evans, J. A. (2026). Measuring Behavior Portability in Large Language Models (arXiv:2606.22797). arXiv. https://arxiv.org/abs/2606.22797
- Dong, Y., Wu, F., Zhang, K., et al. (2025). Large Language Model Agents in Finance: A Survey Bridging Research, Practice, and Real-World Deployment. In Findings of the Association for Computational Linguistics: EMNLP 2025 (pp. 17889–17907). Association for Computational Linguistics. https://doi.org/10.18653/v1/2025.findings-emnlp.972
- Duan, Q., Li, C., Wang, C., et al. (2026). Can Agentic Trading Systems Pay for Their Own Intelligence? (arXiv:2607.10286v2). arXiv. https://arxiv.org/abs/2607.10286v2
- Engel, C., Großmann, M. R. P., & Ockenfels, A. (2025). Integrating machine behavior into human subject experiments: a user-friendly toolkit and an application to framed prisoner’s dilemmas. Experimental Economics, 28, 1085–1100. https://doi.org/10.1017/eec.2025.10038
- Erdem, O., & Ashok, R. P. (2025). Artificial Finance: How AI Thinks About Money (arXiv:2507.10933). arXiv. https://arxiv.org/abs/2507.10933. Published version: LLMs are not weird: Comparing AI and human financial decision-making. Journal of Behavioral and Experimental Economics 120:102505 (2026). https://doi.org/10.1016/j.socec.2025.102505
- Fedyk, A., Kakhbod, A., Li, P., & Malmendier, U. (2025). AI and perception biases in investments: An experimental study (Working paper, draft of June 2025). https://eml.berkeley.edu/~ulrike/Papers/AI_PerceptionBias_aug2025.pdf. Published version: Journal of Financial Economics 185:104350 (2026). https://doi.org/10.1016/j.jfineco.2026.104350
- Feng, Y., Choudhary, V., & Shrestha, Y. R. (2025). Noise, Adaptation, and Strategy: Assessing LLM Fidelity in Decision-Making. In Proceedings of the 2025 Conference on Empirical Methods in Natural Language Processing (pp. 7693–7706). Association for Computational Linguistics. https://doi.org/10.18653/v1/2025.emnlp-main.391
- Feuerriegel, S., Barrie, C., Crockett, M. J., et al. (2026). A reporting checklist for large language models in behavioural science. Nature Human Behaviour, 10, 1182–1186. https://doi.org/10.1038/s41562-026-02492-7
- Foltyn, R., & Olsson, J. (2026). The Worth of a “Wo”: Gender Bias in Financial Advice from LLMs (NHH Department of Economics Discussion Paper SAM 04/2026). https://nva.sikt.no/registration/019c9dd82846-c8bcfc07-b8da-430f-8a58-7c1eb56a4449
- Fu, W. (2025). The New Quant: A Survey of Large Language Models in Financial Prediction and Trading (arXiv:2510.05533). arXiv. https://arxiv.org/abs/2510.05533
- Galanis, S. (2026). Information Aggregation with AI Agents (arXiv:2604.20050v3). arXiv. https://arxiv.org/abs/2604.20050v3
- Gamble, K. J., & Hummel, P. (2026). When Machines Think Fast: A Behavioral Economics Test of AI (SSRN Working Paper 6843005, version posted June 12, 2026). https://doi.org/10.2139/ssrn.6843005
- Gao, S., Wen, Y., Zhu, M., et al. (2024). Simulating Financial Market via Large Language Model based Agents (arXiv:2406.19966). arXiv. https://arxiv.org/abs/2406.19966
- Gao, T., Peng, L., Xu, Q., & Li, G. (2026). Heterogeneous-Agent Financial Market Simulation with Large Language Models. Procedia Computer Science, 287, 1016–1023. https://doi.org/10.1016/j.procs.2026.08.142
- Gao, Y., Lee, D., Burtch, G., & Fazelpour, S. (2025). Take Caution in Using LLMs as Human Surrogates: Scylla Ex Machina (arXiv:2410.19599v3). arXiv. https://arxiv.org/abs/2410.19599v3. Published version: Take caution in using LLMs as human surrogates. Proceedings of the National Academy of Sciences 122(24):e2501660122 (2025). https://doi.org/10.1073/pnas.2501660122
- Gao, Z., Jiang, W., & Yan, Y. (2026a). Debiasing LLMs by Fine-tuning (arXiv:2604.02921v2). arXiv. https://arxiv.org/abs/2604.02921v2
- Gao, Z., Jiang, W., & Yan, Y. (2026b). Detecting Lookahead Bias in LLM Forecasts (arXiv:2512.23847v2). arXiv. https://arxiv.org/abs/2512.23847v2
- Garcia, J. (2025). Homo Silicus is Hyper-Rational: Why LLM Agents Fail to Replicate Attention-Driven Trading (SSRN Working Paper 5901742, version revised February 16, 2026). https://doi.org/10.2139/ssrn.5901742
- Garcia, J. (2026a). Algorithmic Anchoring: How Prompt-Embedded Reference Points Bias LLM Financial Estimates (SSRN Working Paper 6366838, version posted March 9, 2026). https://doi.org/10.2139/ssrn.6366838
- Garcia, J. (2026b). Are Aliases Neutral? Company-Name Form in LLM Equity Valuation (SSRN Working Paper 7532416). https://doi.org/10.2139/ssrn.7532416
- Garcia, J. (2026c). Which Number Is Sticky? What Survives Source Withdrawal in Sequential LLM Financial Analysis (SSRN Working Paper 7411618, version revised September 16, 2026). https://doi.org/10.2139/ssrn.7411618
- Gençay, E. (2026). What survives honest evaluation? Leakage-safe, search-aware assessment of LLM-driven trading strategy discovery (arXiv:2608.27734). arXiv. https://arxiv.org/abs/2608.27734
- Gensler, G., & Bailey, L. (2020). Deep Learning and Financial Stability (SSRN Working Paper 3723132). https://doi.org/10.2139/ssrn.3723132
- Gode, D. K., & Sunder, S. (1993). Allocative Efficiency of Markets with Zero-Intelligence Traders: Market as a Partial Substitute for Individual Rationality. Journal of Political Economy, 101, 119–137. https://doi.org/10.1086/261868
- Graham, J. R., Harvey, C. R., & Jha, M. (2026). CFOs Meet LLMs (arXiv:2606.13812v2). arXiv. https://arxiv.org/abs/2606.13812v2
- Greenwood, R., & Thesmar, D. (2011). Stock price fragility. Journal of Financial Economics, 102, 471–490. https://doi.org/10.1016/j.jfineco.2011.06.003
- Hansen, A. L., Horton, J. J., Kazinnik, S., et al. (2025). Simulating the Survey of Professional Forecasters (SSRN Working Paper 5066286, draft of February 2025). https://doi.org/10.2139/ssrn.5066286
- Hansen, A. L., & Lee, S. J. (2025). Financial Stability Implications of Generative AI: Taming the Animal Spirits (arXiv:2510.01451). arXiv. https://arxiv.org/abs/2510.01451. Also issued as Finance and Economics Discussion Series 2025-090, Board of Governors of the Federal Reserve System. https://doi.org/10.17016/feds.2025.090
- Hartley, J., Hamill, C. B., Seddon, D., et al. (2025). How Personality Traits Shape LLM Risk-Taking Behaviour. In Findings of the Association for Computational Linguistics: ACL 2025 (pp. 21068–21092). Association for Computational Linguistics. https://doi.org/10.18653/v1/2025.findings-acl.1085
- Hashimoto, R., Takayanagi, T., Suzuki, M., & Izumi, K. (2025). Agent-Based Simulation of a Financial Market with Large Language Models (arXiv:2510.12189). arXiv. https://arxiv.org/abs/2510.12189. Published version: LLM agents reveal how human bias shapes path-dependent market dynamics. Journal of Computational Social Science 9(2):32 (2026). https://doi.org/10.1007/s42001-026-00465-4
- He, S., Lv, L., Manela, A., & Wu, J. (2025). Instruction Tuning Chronologically Consistent Language Models (arXiv:2510.11677v2). arXiv. https://arxiv.org/abs/2510.11677v2
- Heemeijer, P., Hommes, C., Sonnemans, J., & Tuinstra, J. (2009). Price stability and volatility in markets with positive and negative expectations feedback: An experimental investigation. Journal of Economic Dynamics and Control, 33, 1052–1072. https://doi.org/10.1016/j.jedc.2008.09.009
- Henning, T., Ojha, S. M., Spoon, R., et al. (2025). LLM Agents Do Not Replicate Human Market Traders: Evidence From Experimental Finance (arXiv:2502.15800v3). arXiv. https://arxiv.org/abs/2502.15800v3
- Hintze, A., Bisht, C., Schossau, J., & Hertwig, R. (2025). Nonlinear transformation of probabilities by large language models. Computers in Human Behavior: Artificial Humans, 6, 100227. https://doi.org/10.1016/j.chbah.2025.100227
- Hirano, M. (2025). Building LLM-Based Artificial Market Simulations: Can LLMs Function as Agents in Multi-agent Simulations for Finance? In PRIMA 2025: Principles and Practice of Multi-Agent Systems (pp. 56–71). Springer Nature Switzerland. https://doi.org/10.1007/978-3-032-13562-9_5
- Hommes, C. (2011). The heterogeneous expectations hypothesis: Some evidence from the lab. Journal of Economic Dynamics and Control, 35, 1–24. https://doi.org/10.1016/j.jedc.2010.10.003
- Hommes, C., Sonnemans, J., Tuinstra, J., & van de Velden, H. (2008). Expectations and bubbles in asset pricing experiments. Journal of Economic Behavior & Organization, 67, 116–133. https://doi.org/10.1016/j.jebo.2007.06.006
- Horton, J. J., Filippas, A., & Manning, B. S. (2026). Large Language Models as Simulated Economic Agents: What Can We Learn from Homo Silicus? (arXiv:2301.07543v2). arXiv. https://arxiv.org/abs/2301.07543v2. Published version (extended abstract): Proceedings of the 25th ACM Conference on Economics and Computation, pp 614–615 (2024). https://doi.org/10.1145/3670865.3673513
- Hu, X., & Zhao, J. (2026). Fin-Bias: Comprehensive Evaluation for LLM Decision-Making under human bias in Finance Domain (arXiv:2605.09106). arXiv. https://arxiv.org/abs/2605.09106. Published version: Findings of the Association for Computational Linguistics: ACL 2026, pp 5678–5694 (2026). https://doi.org/10.18653/v1/2026.findings-acl.279
- Huang, C., Chen, C., Lin, C., et al. (2026a). Probing Outcome-Level Resemblance and Mechanism-Level Alignment in LLM Risk Decisions: Evidence from the St. Petersburg Game (arXiv:2606.04978). arXiv. https://arxiv.org/abs/2606.04978
- Huang, Y., Bie, B., Na, Z., et al. (2026b). Understanding the Anchoring Effect of LLM with Synthetic Data: Existence, Mechanism, and Potential Mitigations (arXiv:2505.15392v2). arXiv. https://arxiv.org/abs/2505.15392v2
- Itzhak, I., Stanovsky, G., Rosenfeld, N., & Belinkov, Y. (2024). Instructed to Bias: Instruction-Tuned Language Models Exhibit Emergent Cognitive Bias (arXiv:2308.00225v2). arXiv. https://arxiv.org/abs/2308.00225v2. Published version: Transactions of the Association for Computational Linguistics 12:771–785 (2024). https://doi.org/10.1162/tacl_a_00673
- Jadhav, A., & Mirza, V. (2025). Large Language Models in equity markets: applications, techniques, and insights. Frontiers in Artificial Intelligence, 8, 1608365. https://doi.org/10.3389/frai.2025.1608365
- Jia, J., & Yuan, Z. (2024). An Experimental Study of Competitive Market Behavior Through LLMs (arXiv:2409.08357v2). arXiv. https://arxiv.org/abs/2409.08357v2
- Jia, J., Yuan, Z., Pan, J., et al. (2024). Decision-Making Behavior Evaluation Framework for LLMs under Uncertain Context (arXiv:2406.05972v2). arXiv. https://arxiv.org/abs/2406.05972v2. Published version: Advances in Neural Information Processing Systems 37, pp 113360–113382 (2024). https://doi.org/10.52202/079017-3601
- Jo, N., Garg, N., & Raghavan, M. (2026). The Subjectivity of Monoculture (arXiv:2602.24086v1). arXiv. https://arxiv.org/abs/2602.24086v1
- Kazinnik, S. (2026). Bank Run, Interrupted: Modeling Deposit Withdrawals with Generative AI. Management Science. https://doi.org/10.1287/mnsc.2024.06807
- Khandani, A. E., & Lo, A. W. (2011). What happened to the quants in August 2007? Evidence from factors and transactions data. Journal of Financial Markets, 14, 1–46. https://doi.org/10.1016/j.finmar.2010.07.005
- Khatchadourian, R., & Franco, R. (2025). LLM Output Drift: Cross-Provider Validation & Mitigation for Financial Workflows (arXiv:2511.07585). arXiv. https://arxiv.org/abs/2511.07585
- Khoukhi, A., & Slimani, I. (2026). From Agent-Based Models to LLM-Based Financial Agents: A PRISMA-Based Systematic Review, Multidimensional Taxonomy, and Future Research Agenda (SSRN Working Paper 7493756). https://doi.org/10.2139/ssrn.7493756
- Kim, A., Muhn, M., & Nikolaev, V. (2024). Financial Statement Analysis with Large Language Models (arXiv:2407.17866v2). arXiv. https://arxiv.org/abs/2407.17866v2. Withdrawn by the authors in arXiv version 3 (February 20, 2025); the text of version 2 was read.
- Kim, E. M., Garg, A., Peng, K., & Garg, N. (2025). Correlated Errors in Large Language Models. In Proceedings of the 42nd International Conference on Machine Learning (pp. 30038–30066). PMLR. https://proceedings.mlr.press/v267/kim25e.html
- Kleinberg, J., & Raghavan, M. (2021). Algorithmic monoculture and social welfare. Proceedings of the National Academy of Sciences, 118, e2018340118. https://doi.org/10.1073/pnas.2018340118
- Knipper, R. A., Knipper, C. S., Zhang, K., et al. (2025). The Bias is in the Details: An Assessment of Cognitive Bias in LLMs (arXiv:2509.22856). arXiv. https://arxiv.org/abs/2509.22856
- Kong, Y., Lee, H., Hwang, Y., et al. (2026). Evaluating LLMs in Finance Requires Explicit Bias Consideration (arXiv:2602.14233). arXiv. https://arxiv.org/abs/2602.14233
- Kong, Y., Nie, Y., Dong, X., et al. (2024). Large Language Models for Financial and Investment Management: Applications and Benchmarks. The Journal of Portfolio Management, 51, 162–210. https://doi.org/10.3905/jpm.2024.1.645
- Koviazin, A., Mudarisov, T., Polyachenko, E., & State, R. (2026). Reproducibility in the TradingAgents Framework. In Proceedings of the 2026 International Conference on Artificial Intelligence and Fintech (pp. 365–370). ACM. https://doi.org/10.1145/3800973.3801029
- Lakonishok, J., Shleifer, A., & Vishny, R. W. (1992). The impact of institutional trading on stock prices. Journal of Financial Economics, 32, 23–43. https://doi.org/10.1016/0304-405x(92)90023-q
- LeBaron, B. (2006). Agent-based computational finance. In L. Tesfatsion & K. L. Judd (Eds.), Handbook of Computational Economics (Vol. 2, pp. 1187–1233). Elsevier. https://doi.org/10.1016/s1574-0021(05)02024-1
- Lee, H., Park, S., Lee, S., et al. (2026). When Summaries Distort Decisions: Information Fidelity in LLM-Compressed Financial Analysis (arXiv:2606.29251v3). arXiv. https://arxiv.org/abs/2606.29251v3
- Lee, H., Seo, J., Park, S., et al. (2025). Your AI, Not Your View: The Bias of LLMs in Investment Analysis (arXiv:2507.20957v4). arXiv. https://arxiv.org/abs/2507.20957v4. Published version: Proceedings of the 6th ACM International Conference on AI in Finance, pp 150–158 (2025). https://doi.org/10.1145/3768292.3770375
- Lehner, S., & Lopez-Lira, A. (2026). ChatGPT as a Time Capsule: The Limits of Price Discovery (arXiv:2604.21433). arXiv. https://arxiv.org/abs/2604.21433
- Li, E., Shen, M., Tu, Z., & Zhou, D. (2025a). The Promise and Peril of Generative AI: Evidence from GPT as Sell-Side Analysts (arXiv:2412.01069v2). arXiv. https://arxiv.org/abs/2412.01069v2
- Li, T., & Yu, L. (2025). ESG Beliefs of Large Language Models: Evidence and Impact (arXiv:2601.00836). arXiv. https://arxiv.org/abs/2601.00836
- Li, W. W., Kim, H., Cucuringu, M., & Ma, T. (2026a). Can LLM-based Financial Investing Strategies Outperform the Market in Long Run? (arXiv:2505.07078v6). arXiv. https://arxiv.org/abs/2505.07078v6. Published version: Proceedings of the 32nd ACM SIGKDD Conference on Knowledge Discovery and Data Mining V.1, pp 2711–2722 (2026). https://doi.org/10.1145/3770854.3785702
- Li, X., Zeng, Y., Xing, X., et al. (2025b). Profit Mirage: Revisiting Information Leakage in LLM-based Financial Agents (arXiv:2510.07920). arXiv. https://arxiv.org/abs/2510.07920
- Li, Z., Su, Y., White, M., et al. (2026b). Your Agent Says Yes: Interpreting Adversarial Market Behavior Beyond Individual Transactions (arXiv:2609.07675v2). arXiv. https://arxiv.org/abs/2609.07675v2
- Lim, Y. (2025). Is Artificial Intelligence (AI) Risk-Averse? [Paper presented at the American Finance Association Annual Meeting, January 4, 2025]. https://afajof.org/management/viewp.php?n=86324
- Lin, S. (2025). Real Bubbles, Synthetic Traders: AI-Agent-Based Simulations of the Speculative Market (Bachelor’s thesis, Harvard College). https://dash.harvard.edu/handle/1/42719538
- Liu, J., Song, B., Dixit, V., et al. (2026a). Can large language models capture human risk preferences? A cross-cultural study. Communications in Transportation Research, 6, 9640025. https://doi.org/10.26599/commtr.2026.9640025
- Liu, K., & Chen, L. (2026). OOM-RL: Out-of-Money Reinforcement Learning Market-Driven Alignment for LLM-Based Multi-Agent Systems (arXiv:2604.11477). arXiv. https://arxiv.org/abs/2604.11477
- Liu, M., & Liu, Z. (2026). Reading Is Not Using: Retrieval, Judgment, and the Design of AI Financial Research Workflows (arXiv:2608.24842). arXiv. https://arxiv.org/abs/2608.24842
- Liu, Q., Yao, L., Wang, Z., et al. (2026b). Large language model-based multi-agent systems for financial markets simulation: a survey. Science China Information Sciences, 69, 171201. https://doi.org/10.1007/s11432-026-4986-x
- Lopez-Lira, A. (2025). Can Large Language Models Trade? Testing Financial Theories with LLM Agents in Market Simulations (arXiv:2504.10789). arXiv. https://arxiv.org/abs/2504.10789
- Lopez-Lira, A., Tang, Y., & Zhu, M. (2025). The Memorization Problem: Can We Trust LLMs’ Economic Forecasts? (arXiv:2504.14765v2). arXiv. https://arxiv.org/abs/2504.14765v2
- Lou, J., & Sun, Y. (2024). Anchoring Bias in Large Language Models: An Experimental Study (arXiv:2412.06593v2). arXiv. https://arxiv.org/abs/2412.06593v2. Published version: Journal of Computational Social Science 9(1):11 (2026). https://doi.org/10.1007/s42001-025-00435-2
- Luo, Y., Jiang, Y., Xie, Q., et al. (2026). ReguSim: Evaluating LLM Agent Rule Grounding in Financial Compliance (arXiv:2608.19974). arXiv. https://arxiv.org/abs/2608.19974
- Ma, T., Du, J., Huang, W., et al. (2025). Agent Trading Arena: A Study on Numerical Understanding in LLM-Based Agents (arXiv:2502.17967v2). arXiv. https://arxiv.org/abs/2502.17967v2. Published version: Findings of the Association for Computational Linguistics: EMNLP 2025, pp 5496–5514 (2025). https://doi.org/10.18653/v1/2025.findings-emnlp.294
- Magar, J. (2026). Man v Machine: Technical System Architecture and Design Rationale (SSRN Working Paper 6823938). https://doi.org/10.2139/ssrn.6823938
- Maresca, C. (2026). Can Interest-Bearing Positions Solve the Long-Horizon Problem in Prediction Markets? (arXiv:2602.21091). arXiv. https://arxiv.org/abs/2602.21091
- Mei, Q., Xie, Y., Yuan, W., & Jackson, M. O. (2024). A Turing Test: Are AI Chatbots Behaviorally Similar to Humans? (arXiv:2312.00798v2). arXiv. https://arxiv.org/abs/2312.00798v2. Published version: A Turing test of whether AI chatbots are behaviorally similar to humans. Proceedings of the National Academy of Sciences 121(9):e2313925121 (2024). https://doi.org/10.1073/pnas.2313925121
- Menon, A., Saebo, M., Crosse, T., et al. (2026). Inherited Goal Drift: Contextual Pressure Can Undermine Agentic Goals (arXiv:2603.03258). arXiv. https://arxiv.org/abs/2603.03258
- Miyazaki, K., Kawahara, T., Roberts, S., & Zohren, S. (2026). Toward Expert Investment Teams: A Multi-Agent LLM System with Fine-Grained Trading Tasks (arXiv:2602.23330). arXiv. https://arxiv.org/abs/2602.23330. Published version: The Journal of Financial Data Science 8(3):168–202 (2026). https://doi.org/10.3905/jfds.2026.008
- Morla, T., Bellibatlu, R. R., Singh, M., & Kapoor, M. S. (2026). AgentFairBench: Do LLM Agents Discriminate When They Act? (arXiv:2606.16723v2). arXiv. https://arxiv.org/abs/2606.16723v2. Published version: IEEE Access (2026). https://doi.org/10.1109/access.2026.3736808
- Na, C., Ni, H., Szpruch, L., et al. (2026). Poisoning Agentic Alpha: Adversarial Vulnerabilities Across Roles and Architectures in Multi-Agent Trading Systems (arXiv:2608.24069). arXiv. https://arxiv.org/abs/2608.24069
- Nguyen, P., & Pham, T. (2026). Toward Reliable Evaluation of LLM-Based Financial Multi-Agent Systems: Taxonomy, Coordination Primacy, and Cost Awareness (arXiv:2603.27539). arXiv. https://arxiv.org/abs/2603.27539. Published version: Trends and Applications in Knowledge Discovery and Data Mining, pp 324–336 (2026). https://doi.org/10.1007/978-981-92-2014-4_26
- Ostrovsky, M. (2012). Information Aggregation in Dynamic Markets With Strategic Traders. Econometrica, 80, 2595–2647. https://doi.org/10.3982/ecta8479
- Ouyang, S., & Sui, P. (2026). Dissecting AI Trading: Behavioral Finance and Market Bubbles (arXiv:2604.18373). arXiv. https://arxiv.org/abs/2604.18373
- Ouyang, S., Yun, H., & Zheng, X. (2025). AI as Decision-Maker: Ethics and Risk Preferences of LLMs (arXiv:2406.01168v3). arXiv. https://arxiv.org/abs/2406.01168v3
- Park, S., Park, S., Lee, H., et al. (2026). Your AI, On a Dial: Controlling Investment Bias in LLMs with a Single Neuron (arXiv:2608.22852). arXiv. https://arxiv.org/abs/2608.22852
- Payne, K. (2025). An analysis of AI Decision under Risk: Prospect theory emerges in Large Language Models (arXiv:2508.00902). arXiv. https://arxiv.org/abs/2508.00902
- Powdthavee, N. (2026). Large Language Models Outperform Humans in Fraud Detection and Resistance to Motivated Investor Pressure (arXiv:2604.20652). arXiv. https://arxiv.org/abs/2604.20652
- Qian, H. (2026). Nous: An Attempt to Extract and Inject the Cognition Behind Prediction-Market Behavior (arXiv:2606.13038). arXiv. https://arxiv.org/abs/2606.13038
- Ross, J., & Lo, A. W. (2026). One Size Fits None: Heuristic Collapse in LLM Investment Advice (arXiv:2604.23837). arXiv. https://arxiv.org/abs/2604.23837
- Ross, J., So, E., De Simone, Z., et al. (2026). Why Better Models Can Create Riskier Systems: Evidence from LLM Agents in Financial Markets (arXiv:2609.04373). arXiv. https://arxiv.org/abs/2609.04373
- Roy, D., Misra, R., Singh, S. K., & Roy, A. (2026). MemGuard-Alpha: Limits of Membership Inference for Detecting and Filtering Memorization-Contaminated Signals in LLM-Based Financial Forecasting (arXiv:2603.26797v2). arXiv. https://arxiv.org/abs/2603.26797v2. The arXiv record lists two authors; the four listed here are those of the version read.
- Roychoudhury, S. (2026). Do Language Models Round and “Manage” Earnings Forecasts? Round Numbers and Meet-or-Beat Beliefs in LLM EPS Forecasts (SSRN Working Paper 7143218). https://doi.org/10.2139/ssrn.7143218
- Ruano, C., & Rajan, S. (2026). Social Contagion and Bank Runs: An Agent-Based Model with LLM Depositors (arXiv:2602.15066). arXiv. https://arxiv.org/abs/2602.15066
- Rumpf, M., Haliassos, M., Kosyakova, T., & Otter, T. (2026). From humans to algorithms: How financial advice differs across professionals, peers, and LLMs (IMFS Working Paper No. 243). https://hdl.handle.net/10419/343086
- Safder, M. U., Gull, A., Elbadry, R., et al. (2026). FinPersona-Bench: A Benchmark for Longitudinal Psychometric Stability of Autonomous Financial Agents (arXiv:2606.31522v2). arXiv. https://arxiv.org/abs/2606.31522v2
- Saxena, M., Pangallo, M., Hommes, C., et al. (2026). Machine Spirits: Speculation and Adaptation of LLM Agents in Asset Markets (arXiv:2604.18602v2). arXiv. https://arxiv.org/abs/2604.18602v2
- Scheurer, J., Balesni, M., & Hobbhahn, M. (2024). Large Language Models can Strategically Deceive their Users when Put Under Pressure (arXiv:2311.07590v4). arXiv. https://arxiv.org/abs/2311.07590v4
- Shah, A., Ye, L., Jaskowski, S., et al. (2025a). Beyond the Reported Cutoff: Where Large Language Models Fall Short on Financial Knowledge (arXiv:2504.00042v2). arXiv. https://arxiv.org/abs/2504.00042v2
- Shah, A., Zhu, K., Jiang, Y., et al. (2025b). Learning from Synthetic Labs: Language Models as Auction Participants (arXiv:2507.09083v1). arXiv. https://arxiv.org/abs/2507.09083v1
- Shi, J., & Hollifield, B. (2025). Market-Dependent Communication in Multi-Agent Alpha Generation (arXiv:2511.13614). arXiv. https://arxiv.org/abs/2511.13614
- Shkolnikov, Y. P. (2026). From Deceptive Outputs to Deceptive Mechanisms: A Causal Framework for Language-Model Deception Research (arXiv:2609.04166v1). arXiv. https://arxiv.org/abs/2609.04166v1
- Sias, R. W. (2004). Institutional Herding. The Review of Financial Studies, 17, 165–206. https://doi.org/10.1093/rfs/hhg035
- Smith, V. L. (1962). An Experimental Study of Competitive Market Behavior. Journal of Political Economy, 70, 111–137. https://doi.org/10.1086/258609
- Smith, V. L., Suchanek, G. L., & Williams, A. W. (1988). Bubbles, Crashes, and Endogenous Expectations in Experimental Spot Asset Markets. Econometrica, 56, 1119–1151. https://doi.org/10.2307/1911361
- So, E. (2026). The Profit Alignment Problem: How Profit Mandates Induce Alignment Failures in LLMs (arXiv:2609.07731). arXiv. https://arxiv.org/abs/2609.07731
- Struski, P., Swistak, J., Okulska, I., & Biecek, P. (2026). Competitive Market Behavior of LLMs (arXiv:2609.02580). arXiv. https://arxiv.org/abs/2609.02580
- Sua, Q. R., Dong, J., Thai, N. D., et al. (2026). Contagion on the Trading Floor: How Adversarial Signals Spread in Multi-Agent Trading Systems (arXiv:2609.19789). arXiv. https://arxiv.org/abs/2609.19789. Published version: Machine Learning and Knowledge Discovery in Databases. Research Track, pp 206–223 (2026). https://doi.org/10.1007/978-3-032-37673-2_12
- Sun, B., Min, R., Wang, Y., et al. (2026). Some Large Language Models Exhibit Consistent Risk Attitudes (arXiv:2607.16197). arXiv. https://arxiv.org/abs/2607.16197
- Tan, L., & Li, C. (2024). Dissecting Disposition Effect of Large Language Models in Financial Decisions (SSRN Working Paper 4818096). https://doi.org/10.2139/ssrn.4818096
- Tian, A., Ding, A., Wu, S., & Chan, A. (2026). FIDES: A Concordance Protocol for LLM-Generated Trading Strategies (arXiv:2608.23308). arXiv. https://arxiv.org/abs/2608.23308
- Tolety, S. (2025). Tacit Bidder-Side Collusion: Artificial Intelligence in Dynamic Auctions (arXiv:2511.21802). arXiv. https://arxiv.org/abs/2511.21802
- Tricco, A. C., Lillie, E., Zarin, W., et al. (2018). PRISMA Extension for Scoping Reviews (PRISMA-ScR): Checklist and Explanation. Annals of Internal Medicine, 169, 467–473. https://doi.org/10.7326/m18-0850
- Tsuchihashi, T. (2023). How much do you bid? Answers from ChatGPT in first-price and second-price auctions. Journal of Digital Life, 3, 11. https://doi.org/10.51015/jdl.2023.3.11
- Vidler, A., & Walsh, T. (2025). Shifting Power: Leveraging LLMs to Simulate Human Aversion in ABMs of Bilateral Financial Exchanges, A bond market study (arXiv:2503.00320v2). arXiv. https://arxiv.org/abs/2503.00320v2. Published version: Proceedings of the 24th International Conference on Autonomous Agents and Multiagent Systems (AAMAS 2025), pp 2777–2779. https://doi.org/10.65109/ftjv9080
- Wang, C., Wang, C., Zeng, S., et al. (2025a). Advanced simulation paradigm of human behaviour unveils complex financial systemic projection (arXiv:2503.20787v2). arXiv. https://arxiv.org/abs/2503.20787v2
- Wang, H., Pan, Z., Zhang, H., et al. (2025b). InvestAlign: Overcoming Data Scarcity in Aligning Large Language Models with Investor Decision-Making Processes under Herd Behavior (arXiv:2507.06528). arXiv. https://arxiv.org/abs/2507.06528. Published version: Proceedings of the 63rd Annual Meeting of the Association for Computational Linguistics (Volume 1: Long Papers), pp 10021–10052 (2025). https://doi.org/10.18653/v1/2025.acl-long.495
- Wang, R., Lin, Q., Liu, J., et al. (2026a). Rethinking Prospect Theory for LLMs: Revealing the Instability of Decision-Making under Epistemic Uncertainty (arXiv:2508.08992v4). arXiv. https://arxiv.org/abs/2508.08992v4
- Wang, S., Yao, Z., Zhang, S., et al. (2025c). When Experimental Economics Meets Large Language Models: Evidence-based Tactics (arXiv:2505.21371v2). arXiv. https://arxiv.org/abs/2505.21371v2
- Wang, Y., Dai, D., Ma, D., & Geng, K. (2026b). Macro Economists in the Machine: A Multi-Agent LLM Framework for Commodity-Related ETF Portfolio Construction (arXiv:2606.08283). arXiv. https://arxiv.org/abs/2606.08283
- Wang, Z., Liu, Y., Wang, T., & Liu, Z. (2025d). Developmental trajectories of decision making and affective dynamics in large language models (arXiv:2601.14268). arXiv. https://arxiv.org/abs/2601.14268
- Wu, K., Yang, B., Ying, Z., & Zhou, D. (2026). Anonymization and Information Loss (arXiv:2511.15364v2). arXiv. https://arxiv.org/abs/2511.15364v2
- Wu, W. (2026). Auditing Asset-Specific Preferences in Financial Large Language Models: Evidence from Bitcoin Representations and Portfolio Allocation (arXiv:2606.02528v3). arXiv. https://arxiv.org/abs/2606.02528v3
- Xia, Y., You, P., Wang, T., et al. (2026). Agentic Trading: When LLM Agents Meet Financial Markets (arXiv:2605.19337). arXiv. https://arxiv.org/abs/2605.19337
- Yan, Y., Tang, R., Gao, Z., et al. (2026). DatedGPT: Preventing Lookahead Bias in Large Language Models with Time-Aware Pretraining (arXiv:2603.11838v2). arXiv. https://arxiv.org/abs/2603.11838v2
- Yang, W., Liu, H., & Wang, Y. (2026a). From Algorithmic Trading to Generative AI: Artificial Intelligence, Systemic Risk, and the Transformation of Financial Markets. Journal of Economic Surveys. Advance online publication. https://doi.org/10.1111/joes.70167
- Yang, Y., Zhang, Y., Wu, M., et al. (2025). TwinMarket: A Scalable Behavioral and Social Simulation for Financial Markets (arXiv:2502.01506v5). arXiv. https://arxiv.org/abs/2502.01506v5. Published version: Advances in Neural Information Processing Systems 38, pp 70830–70880 (2025). https://doi.org/10.52202/085713-2132
- Yang, Z., Li, R., Qiang, Q., et al. (2026b). FinVault: Benchmarking Financial Agent Safety in Execution-Grounded Environments (arXiv:2601.07853v1). arXiv. https://arxiv.org/abs/2601.07853v1. Withdrawn by the authors in arXiv version 2 (July 30, 2026); the text of version 1 was read.
- Yao, J., Zheng, Z., & Li, B. (2026). Beyond Agent Architecture: Execution Assumptions and Reproducibility in LLM-Based Trading Systems (arXiv:2606.08285v2). arXiv. https://arxiv.org/abs/2606.08285v2. The text of version 2 is titled “Execution Realism and Reproducibility in LLM-Based Trading Systems: A Targeted Review and Audit.”
- Ye, Y., Han, J., Hu, A., et al. (2026). The Alpha Illusion: Reported Alpha from LLM Trading Agents Should Not Be Treated as Deployment Evidence (arXiv:2605.16895). arXiv. https://arxiv.org/abs/2605.16895
- Yechiam, E., & Tarabeih, A. (2026). Mimicry without understanding: the origins of decision bias in large language models (arXiv:2608.12339). arXiv. https://arxiv.org/abs/2608.12339
- Yee, B., & Koh, P. (2026). Calibrating Behavioral Parameters with Large Language Models (arXiv:2602.01022v3). arXiv. https://arxiv.org/abs/2602.01022v3. Version 2 (April 24, 2026) withdrew version 1 for revision; the text of version 3 was read, which is titled “Large Language Models as Calibrated Measurement Instruments for Behavioral Parameters.”
- Yu, B. (2023). Benchmarking Large Language Model Volatility (arXiv:2311.15180). arXiv. https://arxiv.org/abs/2311.15180
- Zhang, C., Liu, X., Zhang, Z., et al. (2026a). When AI Meets Finance (StockAgent): Large Language Model-based Stock Trading in Simulated Real-world Environments (arXiv:2407.18957v5). arXiv. https://arxiv.org/abs/2407.18957v5. Published version: When AI Meets Finance (StockAgent): A Benchmark for Simulating Large Language Model Behaviors in Controlled Trading Environments. ACM Transactions on Intelligent Systems and Technology (2026). https://doi.org/10.1145/3844605
- Zhang, J., Liu, G., Johansson, O., et al. (2026b). Prediction Arena: Benchmarking AI Models on Real-World Prediction Markets (arXiv:2604.07355). arXiv. https://arxiv.org/abs/2604.07355
- Zhu, L., & Cai, M. (2026). Artificial Intelligence in Equity and Crypto Markets: Progress, Profitability Evidence, and the Limits of Automated Investing (arXiv:2609.04917). arXiv. https://arxiv.org/abs/2609.04917
- Zhu, T., Zhao, W., Sun, R., et al. (2026). From Knowing to Doing: A Memory-Controlled Benchmark for LLM Trading Agents on Stock Markets (arXiv:2605.28359). arXiv. https://arxiv.org/abs/2605.28359
- Zou, M., Chen, J., Luo, A., et al. (2026). FinEvo: From Isolated Backtests to Ecological Market Games for Multi-Agent Financial Strategy Evolution (arXiv:2602.00948). arXiv. https://arxiv.org/abs/2602.00948